A Level Maths Sampling and Data Presentation questions
This part of Year 12 statistics asks you to choose and criticise a sampling method and then summarise data: histograms (area is frequency), estimates by interpolation, the mean and standard deviation from coded data, and outliers.
Sampling and Data Presentation questions with mark schemes
Easiest first. Try each question on paper, then open its mark scheme: M marks are for method, A marks for accurate answers that follow from the method, B marks for independent results.
Question 1easy4 marksYear 12
A secondary school has the following numbers of students.
Year 7
Year 8
Year 9
Year 10
Year 11
220
200
180
160
140
The head teacher wants a stratified sample of 45 students to survey about school lunches.
(a) Calculate the number of students that should be sampled from each year group. (2)
(b) Describe how the Year 9 students in the sample would be chosen. (1)
(c) Give one advantage of stratified sampling over simple random sampling in this context. (1)
Mark scheme and answer
(a) Total 900; use \(\dfrac{\text{year size}}{900}\times45\) M1 Year 7: 11, Year 8: 10, Year 9: 9, Year 10: 8, Year 11: 7 A1
(b) Number the Year 9 students 1 to 180, use a random number generator to select distinct numbers until the required students (9) are chosen B1
(c) Each year group is proportionally represented, so opinions (which may differ by age) are reflected B1
Answer: (a) Year 7: 11, Year 8: 10, Year 9: 9, Year 10: 8, Year 11: 7; (b) random numbers within the stratum; (c) proportional representation of year groups
Board notes: Edexcel names simple random, systematic, stratified, quota and opportunity (convenience) sampling. OCR H240/H230 section 2.01 also names cluster sampling. AQA K1 names simple random and opportunity sampling explicitly and expects other methods to be selected or critiqued in context.
Question 2easy3 marksYear 12
A garage has a list of 800 customers in alphabetical order. The manager wants to take a systematic sample of 40 customers.
(a) Explain how she should take the systematic sample. (2)
(b) Give one disadvantage of this method. (1)
Mark scheme and answer
(a) Sampling interval \(800 \div 40 = 20\) B1 Choose a random starting point between 1 and 20, then select every 20th customer after that B1
(b) Requires a complete list (sampling frame); may be biased if the list has a periodic pattern (e.g. families with the same surname next to each other) B1
Answer: (a) interval 20, random start 1–20, then every 20th; (b) needs list / periodic bias
Board notes: Edexcel names simple random, systematic, stratified, quota and opportunity (convenience) sampling. OCR H240/H230 section 2.01 also names cluster sampling. AQA K1 names simple random and opportunity sampling explicitly and expects other methods to be selected or critiqued in context.
Question 3easy4 marksYear 12
A council wants to estimate the mean number of hours of exercise per week taken by adults in a town. A councillor proposes asking the first 50 adults who arrive at the town's leisure centre on a Saturday morning.
(a) Name the type of sampling proposed. (1)
(b) Explain why the sample is likely to be biased and state the likely direction of the bias. (2)
(c) Suggest a better sampling method and explain briefly how it could be carried out. (1)
Mark scheme and answer
(a) Opportunity (convenience) sampling B1
(b) People at a leisure centre are likely to exercise more than typical adults B1 So the estimate of mean exercise time is likely to be too high (overestimate) B1
(c) Simple random sample (or stratified by age) from the electoral register: number adults and choose using random numbers B1
Answer: (a) opportunity; (b) overestimates exercise; (c) random sample from electoral register
Board notes: Edexcel names simple random, systematic, stratified, quota and opportunity (convenience) sampling. OCR H240/H230 section 2.01 also names cluster sampling. AQA K1 names simple random and opportunity sampling explicitly and expects other methods to be selected or critiqued in context.
Question 4easy4 marksYear 12
A company produces 12 000 light bulbs each week and wants to find the mean lifetime of its bulbs. To find the lifetime of a bulb, it must be left on until it fails.
(a) Explain why the company should use a sample rather than a census. (1)
(b) Identify the population and a suitable sampling frame. (2)
(c) State one disadvantage of using a sample. (1)
Mark scheme and answer
(a) Testing destroys the bulbs, so a census would leave none to sell B1
(b) Population: all bulbs produced (e.g. that week) B1 Sampling frame: a list of bulbs, e.g. by serial number from the production log B1
(c) Results may not be accurate/representative of the population (sampling variability or bias) B1
Answer: (a) testing is destructive; (b) all bulbs; serial numbers; (c) sample may not represent population
Board notes: Edexcel names simple random, systematic, stratified, quota and opportunity (convenience) sampling. OCR H240/H230 section 2.01 also names cluster sampling. AQA K1 names simple random and opportunity sampling explicitly and expects other methods to be selected or critiqued in context.
Question 5easy4 marksYear 12
A café owner records the daily maximum temperature, \(t\) °C, and the number of ice creams sold, \(n\), on 20 days in summer when \(t\) ranged from 16 to 29. The regression line of \(n\) on \(t\) is \(n = 7.4t - 58\).
(a) Explain why \(t\) is the explanatory variable. (1)
(b) Interpret the value 7.4 in context. (1)
(c) Use the line to estimate sales on a day when \(t = 22\), and explain why it would not be sensible to use it when \(t = 5\). (2)
Mark scheme and answer
(a) The temperature affects ice-cream sales, not the other way round B1
(b) For each 1 °C rise in maximum temperature, about 7.4 more ice creams are sold B1
(c) \(7.4\times22 - 58 = 104.8\), about 105 ice creams B1 \(t = 5\) is outside the data range (extrapolation) – the line gives a negative number of sales B1
Answer: (a) temperature affects sales; (b) +7.4 per °C; (c) 104.8; t = 5 is extrapolation (negative prediction)
Board notes: Calculating regression lines is excluded from A level Mathematics (DfE L2); interpreting a given line, and recognising extrapolation, is required by all three boards.
Question 6medium4 marksYear 12
A market researcher stands in a town centre and interviews shoppers about a new coffee shop until she has interviewed 30 men and 30 women.
(a) Name this sampling method. (1)
(b) Give one advantage and one disadvantage of this method in this context. (2)
(c) Explain why a stratified sample would be difficult to take in this context. (1)
Mark scheme and answer
(a) Quota sampling B1
(b) Advantage: no sampling frame needed / quick and cheap / quotas ensure both genders represented B1 Disadvantage: not random – the researcher chooses whom to approach, so bias can occur (e.g. only people who look friendly or who are in town at that time) B1
(c) Stratified sampling needs a sampling frame (list of all shoppers) from which to choose randomly, which is not available B1
Board notes: Edexcel names simple random, systematic, stratified, quota and opportunity (convenience) sampling. OCR H240/H230 section 2.01 also names cluster sampling. AQA K1 names simple random and opportunity sampling explicitly and expects other methods to be selected or critiqued in context.
Question 7medium3 marksYear 12
A county has 60 primary schools. An education officer wishes to find out how many minutes of reading pupils do at home each week. She randomly selects 5 of the schools and surveys every Year 6 pupil in those schools.
(a) Name this method of sampling. (1)
(b) Give one advantage and one disadvantage compared with taking a simple random sample of all Year 6 pupils in the county. (2)
Mark scheme and answer
(a) Cluster sampling B1
(b) Advantage: cheaper/quicker – only 5 schools visited; no county-wide list needed B1 Disadvantage: pupils in the same school may be similar, so the sample may be less representative (e.g. if chosen schools are all in affluent areas) B1
Answer: (a) cluster; (b) cheaper; less representative
Board notes: Spec ruling: kept. Cluster sampling is named in the OCR specification (H230/H240 2.01) but not in Edexcel's list of methods, and AQA K1 names only simple random and opportunity sampling explicitly; for Edexcel and AQA candidates treat part (a) as stretch, while part (b) (critiquing a method in context) is on all three specifications.
Question 8medium5 marksYear 12
The time, \(x\) seconds, taken by each of 25 students to complete a puzzle was recorded. It was found that \(\sum x = 1840\) and \(\sum x^2 = 138\,950\).
(a) Find the mean and standard deviation of the times. (3)
(b) An outlier is a value more than 2 standard deviations from the mean. The slowest time was 102 seconds. Determine whether this is an outlier. (2)
(b) \(\bar x + 2\sigma = 97.35\) M1 \(102 \gt 97.35\) so it is an outlier A1
Answer: (a) mean 73.60 s, sd 11.88 s; (b) upper limit 97.35: 102 is an outlier
Board notes: Edexcel defines outliers using either Q1 − 1.5×IQR / Q3 + 1.5×IQR or mean ± 2 or 3 standard deviations, as stated in the question; AQA/OCR use the same conventions. Edexcel uses \(\sigma\) with divisor \(n\) for summary statistics (calculator \(\sigma_x\)); AQA/OCR accept either divisor unless specified.
Question 9medium6 marksYear 12
The masses, \(x\) grams, of 40 apples were coded using \(y = \dfrac{x-100}{5}\). The results were \(\sum y = 86\) and \(\sum y^2 = 412\).
(a) Find the mean and standard deviation of \(y\). (3)
(b) Hence find the mean and standard deviation of the masses of the apples. (3)
Board notes: Coding is explicitly on the Edexcel specification; AQA/OCR cover it under linear transformations of data. Edexcel defines outliers using either Q1 − 1.5×IQR / Q3 + 1.5×IQR or mean ± 2 or 3 standard deviations, as stated in the question; AQA/OCR use the same conventions. Edexcel uses \(\sigma\) with divisor \(n\) for summary statistics (calculator \(\sigma_x\)); AQA/OCR accept either divisor unless specified.
Question 10medium5 marksYear 12
The time, \(t\) minutes, spent on social media by 80 teenagers one evening is summarised below.
\(t\)
0 ≤ t < 10
10 ≤ t < 20
20 ≤ t < 30
30 ≤ t < 45
45 ≤ t < 60
Frequency
8
17
26
21
8
(a) Use linear interpolation to estimate the median. (2)
(b) Estimate the interquartile range. (3)
Mark scheme and answer
(a) Median is the 40th value, in class 20 – 30 M1 \(20 + \dfrac{40-25}{26}\times10 = 25.77\) A1
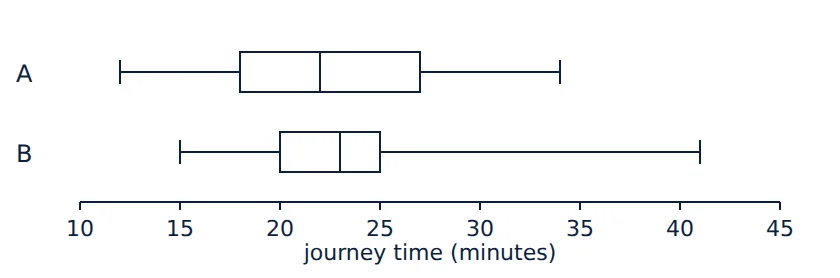
(b) Median B (23) is higher than median A (22), so B typically slightly slower B1 IQR B (5) smaller than IQR A (9), so B times more consistent B1
(c) Route A: it has no extreme long times (max 34) whereas B can take up to 41 minutes; or B for consistency – any reasonable answer supported by the data B1
Board notes: Edexcel defines outliers using either Q1 − 1.5×IQR / Q3 + 1.5×IQR or mean ± 2 or 3 standard deviations, as stated in the question; AQA/OCR use the same conventions. Edexcel uses \(\sigma\) with divisor \(n\) for summary statistics (calculator \(\sigma_x\)); AQA/OCR accept either divisor unless specified.
Question 12medium3 marksYear 12
The ages of guests at a hotel one weekend have lower quartile 31, median 36, upper quartile 48 and mean 40.2.
(a) Describe, with justification, the skewness of the distribution. (2)
(b) State, with a reason, whether the median or the mean is the better measure of a typical age. (1)
(b) Median, as it is not affected by the skew/extreme values B1
Answer: (a) positive skew; (b) median
Board notes: Edexcel defines outliers using either Q1 − 1.5×IQR / Q3 + 1.5×IQR or mean ± 2 or 3 standard deviations, as stated in the question; AQA/OCR use the same conventions. Edexcel uses \(\sigma\) with divisor \(n\) for summary statistics (calculator \(\sigma_x\)); AQA/OCR accept either divisor unless specified.
Question 13medium4 marksYear 12
The marks of 200 candidates in an aptitude test (maximum 100) are summarised in the cumulative frequency table.
Mark less than
20
40
60
80
100
Cumulative frequency
14
52
118
170
200
(a) Estimate the number of candidates who scored 70 or more. (2)
Two students each take a simple random sample of 10 trees from a wood of 2000 trees and measure their heights. Student A obtains a mean of 14.2 m and student B obtains a mean of 16.9 m.
(a) Explain why the two students obtained different means even though both used random sampling. (1)
(b) Suggest how the estimate of the mean height could be made more reliable. (1)
(c) The wood contains 1500 oaks and 500 birches, which grow to different heights. Suggest a more suitable sampling method and explain why. (2)
Mark scheme and answer
(a) Different random samples contain different trees; the sample mean varies from sample to sample (sampling variability) B1
(b) Use a larger sample (or combine the two samples to give 20 trees, mean 15.55 m) B1
(c) Stratified sampling by species (e.g. 15 oaks and 5 birches in a sample of 20) B1 so each species is represented in proportion, reducing variability of the estimate B1
Answer: (a) sampling variability; (b) larger sample; (c) stratified by species
Board notes: Edexcel names simple random, systematic, stratified, quota and opportunity (convenience) sampling. OCR H240/H230 section 2.01 also names cluster sampling. AQA K1 names simple random and opportunity sampling explicitly and expects other methods to be selected or critiqued in context.
Question 15hard6 marksYear 12
A histogram is drawn to show the distances, in km, that commuters travel to work. The class 10 – 15 km has frequency 24 and is represented by a bar of width 1.5 cm and height 4.8 cm.
(a) The class 15 – 25 km has frequency 36. Find the width and height of the bar representing this class. (3)
(b) Estimate the number of commuters in the 15 – 25 km class who travel between 18 km and 25 km, stating an assumption you make. (3)
Mark scheme and answer
(a) Width: \(1.5\times\dfrac{10}{5} = 3.0\) cm B1 Area: \(1.5\times4.8 = 7.2\) cm² for 24 people, i.e. 0.3 cm² per person M1 Height \(= \dfrac{36\times0.3}{3.0} = 3.6\) cm A1
(b) \(\dfrac{7}{10}\times36 = 25.2\), so about 25 commuters M1A1 Assume distances are uniformly spread within the class B1
Answer: (a) width 3.0 cm, height 3.6 cm; (b) 25.2 ≈ 25 (uniform distribution in class)
Board notes: Edexcel regularly sets this "bar dimensions" style; AQA and OCR more often give frequency density directly.
Question 16hard6 marksYear 12
The heart rates, in beats per minute, of 12 athletes have mean 64.5 and standard deviation 5.2. A 13th athlete, with a heart rate of 81, is added to the group.
(a) Find the mean heart rate of the 13 athletes. (2)
(b) Find the standard deviation of the heart rates of the 13 athletes. (4)
Board notes: The given standard deviation is taken as calculated with divisor n (Edexcel convention); if both standard deviations use divisor n−1 the answer is 6.76 - credit either if the assumption is stated.
Question 17hard7 marksYear 12
A student records the time, in seconds, for a pendulum to complete 20 swings, repeating the experiment 10 times. Her recorded values are
42, 38, 45, 4.1, 40, 39, 410, 44, 37, 43
(a) Identify two values that are likely to be recording errors, explaining your reasoning. (2)
(b) Assuming the correct values are 41 in both cases, find the mean and the standard deviation of the cleaned data. (3)
(c) Find the mean of the uncleaned data and comment on the effect of the errors. (2)
Mark scheme and answer
(a) 4.1 – likely a decimal point error for 41 B1 410 – likely an extra zero for 41 (both are far from the other values of about 37–45) B1
(c) Mean \(= 74.21\) B1 Much larger than the cleaned mean because of the extreme value 410; the mean is strongly affected by outliers B1
Answer: (a) 4.1 and 410; (b) mean 41.0, sd 2.45; (c) 74.21, distorted by 410
Board notes: Edexcel defines outliers using either Q1 − 1.5×IQR / Q3 + 1.5×IQR or mean ± 2 or 3 standard deviations, as stated in the question; AQA/OCR use the same conventions. Edexcel uses \(\sigma\) with divisor \(n\) for summary statistics (calculator \(\sigma_x\)); AQA/OCR accept either divisor unless specified.
Question 18hard4 marksYear 12
A factory records the output of a machine every hour, 24 hours a day. Each night shift starts at 22:00 and a new, less experienced operator runs the machine from 22:00 to 06:00. A quality inspector selects a systematic sample by taking the record at 14:00 each day for 30 days.
(a) Explain why this sample is unlikely to be representative of the machine's output. (2)
(b) Describe a stratified sampling method that would give 30 records representative of the whole day. (2)
Mark scheme and answer
(a) The interval (24 hours) matches the daily cycle so every record is from the day shift B1 Night shift output is never sampled, so any difference is missed (biased) B1
(b) Strata: day-shift hours (16/24) and night-shift hours (8/24) B1 20 day-shift and 10 night-shift records, each chosen at random from the list of records in that stratum B1
Answer: (a) periodicity – night shift never sampled; (b) 20 day, 10 night, random within strata
Board notes: Edexcel names simple random, systematic, stratified, quota and opportunity (convenience) sampling. OCR H240/H230 section 2.01 also names cluster sampling. AQA K1 names simple random and opportunity sampling explicitly and expects other methods to be selected or critiqued in context.
Question 19hard4 marksYear 12
A supermarket employs 600 staff, classified as follows.
Under 30
30 and over
Full-time
124
286
Part-time
58
132
A stratified sample of 50 staff is required, stratified by both contract type and age group.
(a) Find the number of staff from each stratum to be included in the sample, showing that your numbers total 50. (3)
(b) Give a reason why the manager might choose a quota sample instead. (1)
Mark scheme and answer
(a) \(\dfrac{\text{stratum}}{600}\times50\) M1 Full-time Under 30: 10.3; Full-time 30 and over: 23.8; Part-time Under 30: 4.83; Part-time 30 and over: 11.0 A1 Rounded: 10, 24, 5, 11 (total 50) A1
(b) Quicker/cheaper; staff can be approached as they are available, with no need for a complete list or random selection B1
Answer: (a) Full-time Under 30: 10, Full-time 30 and over: 24, Part-time Under 30: 5, Part-time 30 and over: 11; (b) quicker, no sampling frame needed
Board notes: Edexcel names simple random, systematic, stratified, quota and opportunity (convenience) sampling. OCR H240/H230 section 2.01 also names cluster sampling. AQA K1 names simple random and opportunity sampling explicitly and expects other methods to be selected or critiqued in context.
Question 20challenging6 marksYear 12
Two classes sat the same test. Class P (18 students) had mean 72.0 and standard deviation 6.0. Class Q (22 students) had mean 78.0 and standard deviation 8.0.
(a) Find the mean mark of all 40 students. (2)
(b) Find the standard deviation of the marks of all 40 students. (4)
Board notes: Edexcel defines outliers using either Q1 − 1.5×IQR / Q3 + 1.5×IQR or mean ± 2 or 3 standard deviations, as stated in the question; AQA/OCR use the same conventions. Edexcel uses \(\sigma\) with divisor \(n\) for summary statistics (calculator \(\sigma_x\)); AQA/OCR accept either divisor unless specified.
Original questions in the style of Edexcel 9MA0, independently checked before publishing. Not past-paper questions. Covers: Stratified sampling, Systematic sampling, Bias in sampling, Population, sample and census, Regression lines, Quota sampling, Cluster sampling and comparing methods, Mean, standard deviation and outliers, Coding, Interpolation for median and quartiles, Box plots and outliers, Skewness, Cumulative frequency and percentiles, Samples and inference, Histograms, Updating summary statistics, Cleaning data, Combining data sets.
Keep practising sampling and data presentation
Free account, no card: 5 more practice questions on every topic with instant feedback, answers and mark schemes on free questions, and your streak and progress on any device.Join free
Is sampling and data presentation on AS or A Level Maths?
It is AS content, usually taught in Year 12, and it is on the full A Level exams too.
Are these past paper questions?
No. All 20 questions are original, written in the style of Edexcel 9MA0 with M, A and B marks. The same content is on the AQA and OCR A Level Maths specifications, so they work for every board.
What is the difference between stratified and quota sampling?
Both split the population into groups, but stratified sampling then picks at random within each group, while quota sampling lets the interviewer choose who fills each quota, so it is not random.
 A Level Math Revision