A Level Maths Year 1 starter questions: weeks 14–26
39 short questions to open a lesson for A Level Maths Year 1 (AS), weeks 14–26 of the teaching year, three or four a week. Each question is shown as an image with its text underneath; answers and mark schemes stay with teachers.
- ← A Level Maths Year 1, weeks 1–13
- A Level Maths Year 1, weeks 27–40 →
- All A Level Maths daily and weekly questions
Week 14
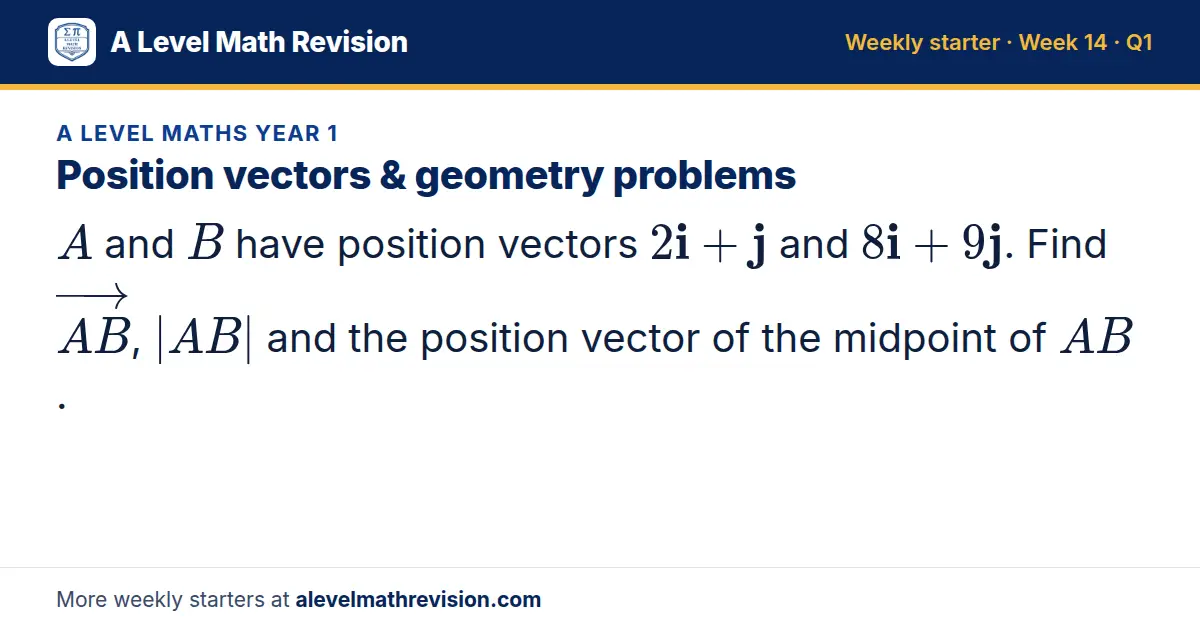
Question 1: Position vectors & geometry problems
A and B have position vectors 2i + j and 8i + 9j. Find AB, |AB| and the position vector of the midpoint of AB.
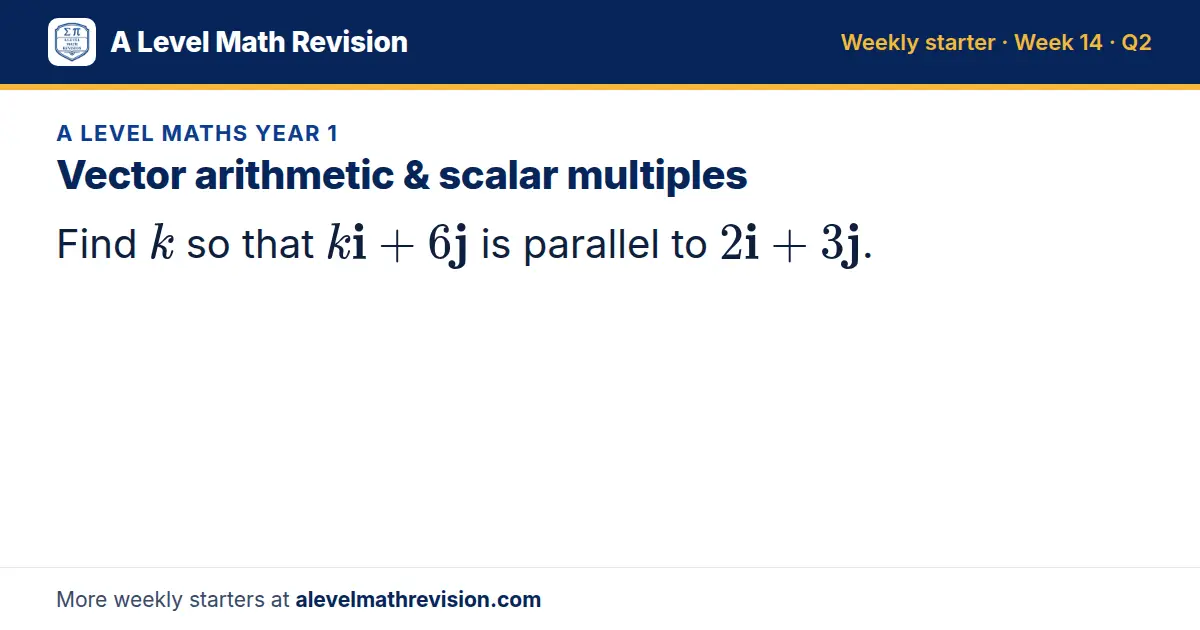
Question 2: Vector arithmetic & scalar multiples
Find k so that ki + 6j is parallel to 2i + 3j.
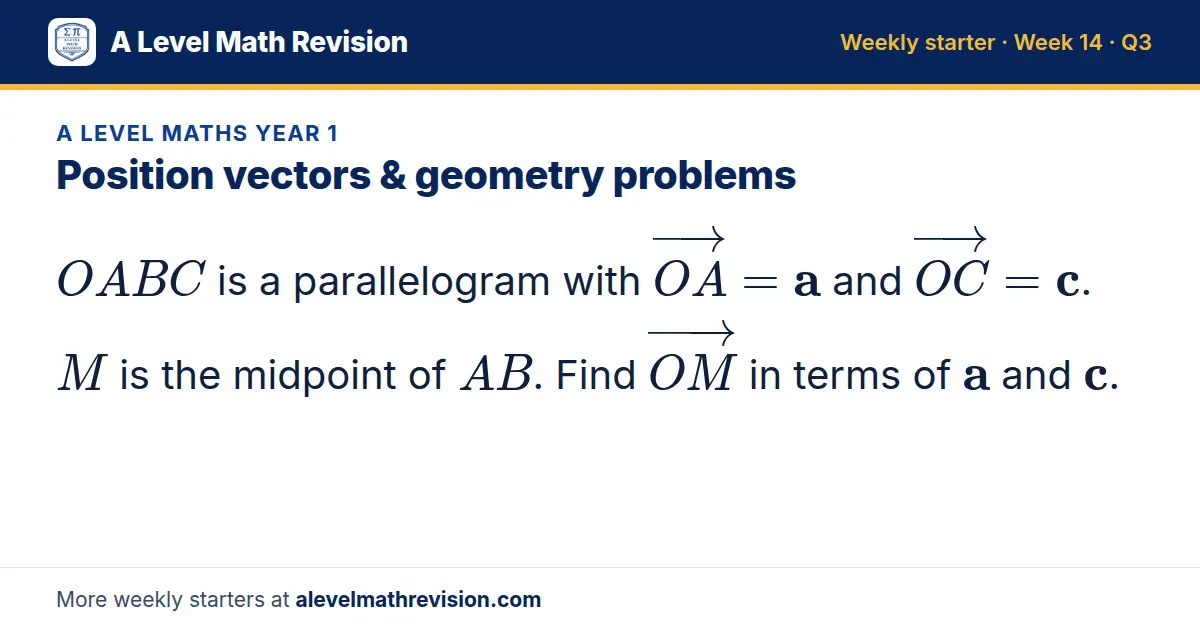
Question 3: Position vectors & geometry problems
OABC is a parallelogram with OA = a and OC = c. M is the midpoint of AB. Find OM in terms of a and c.
Week 15
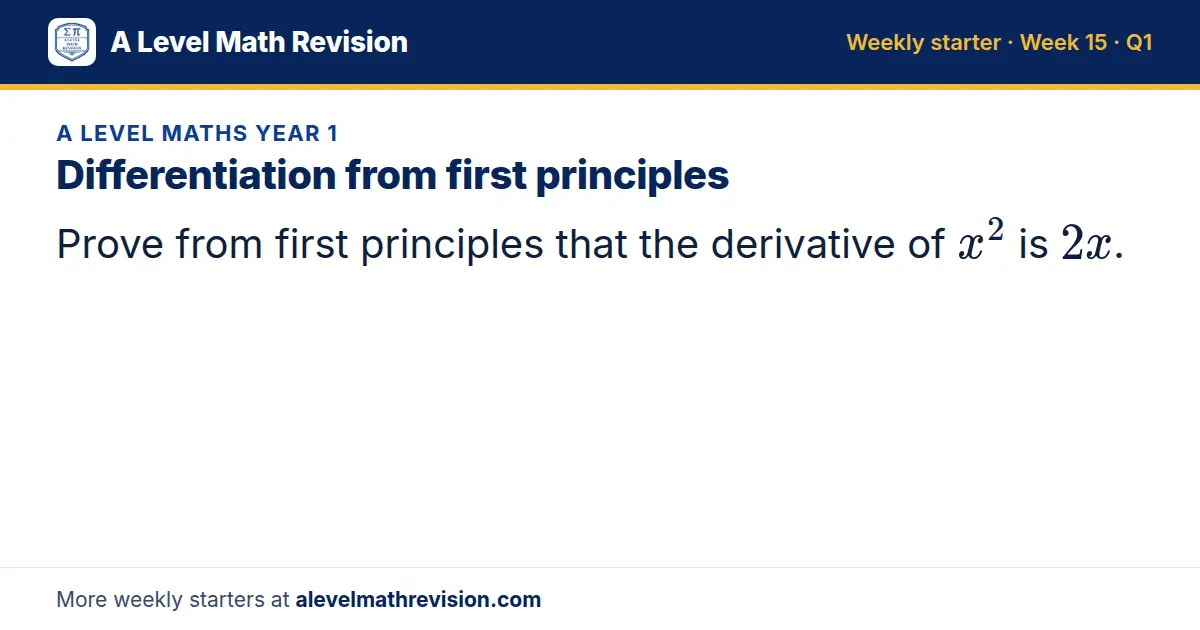
Question 1: Differentiation from first principles
Prove from first principles that the derivative of x² is 2x.
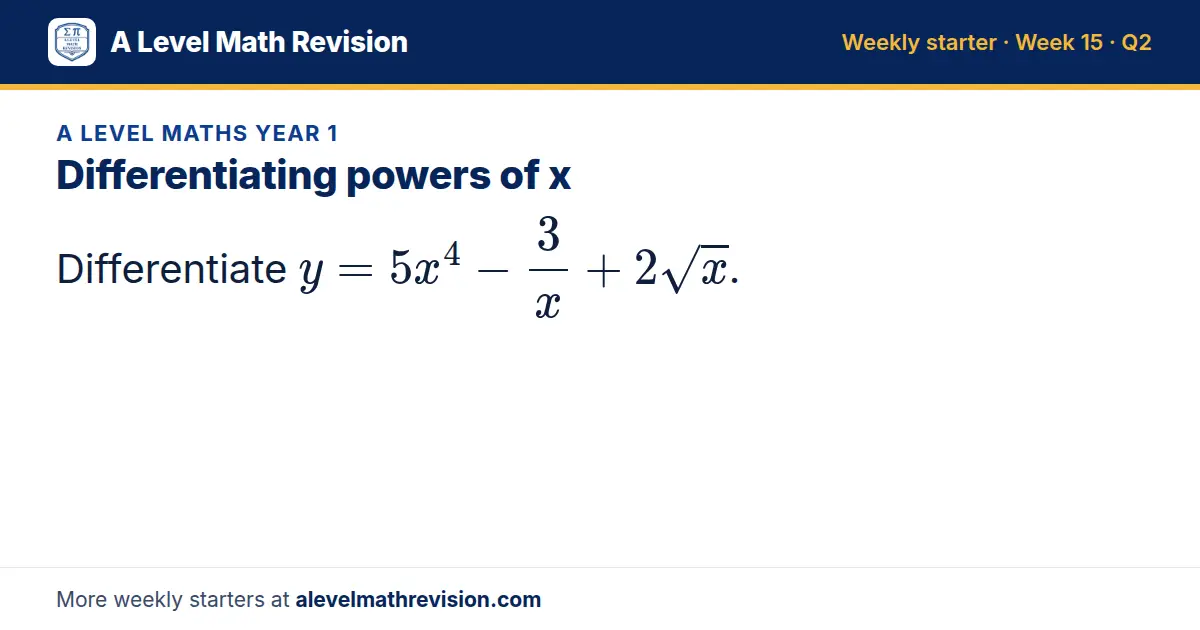
Question 2: Differentiating powers of x
Differentiate y = 5x⁴ - 3/x + 2√x.
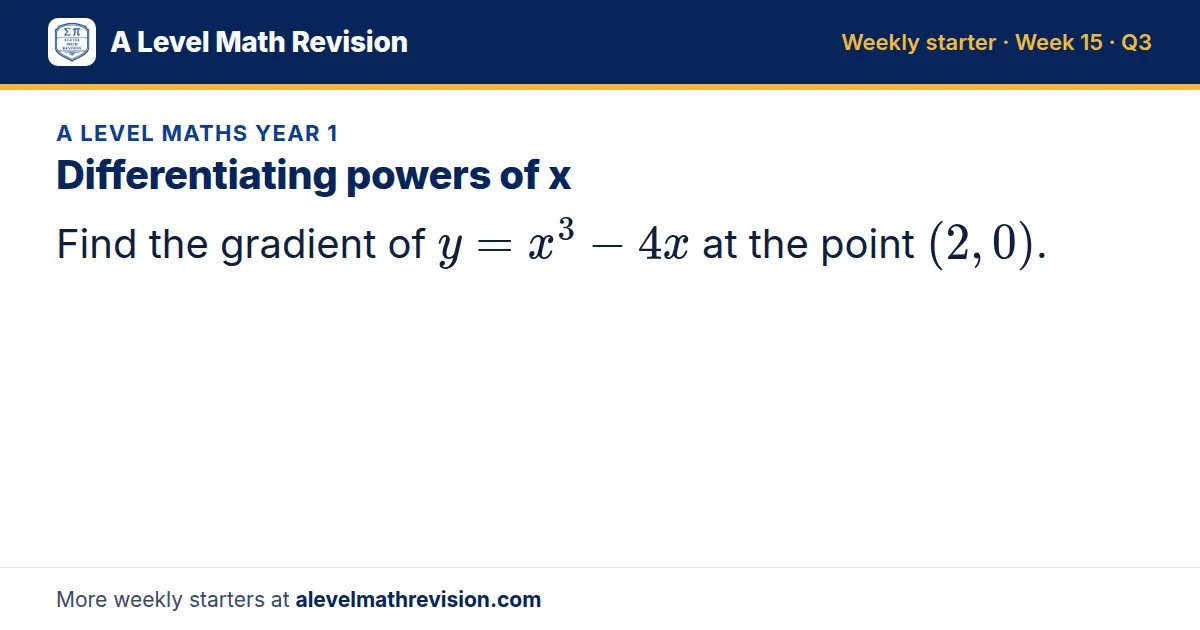
Question 3: Differentiating powers of x
Find the gradient of y = x³ - 4x at the point (2, 0).
Week 16
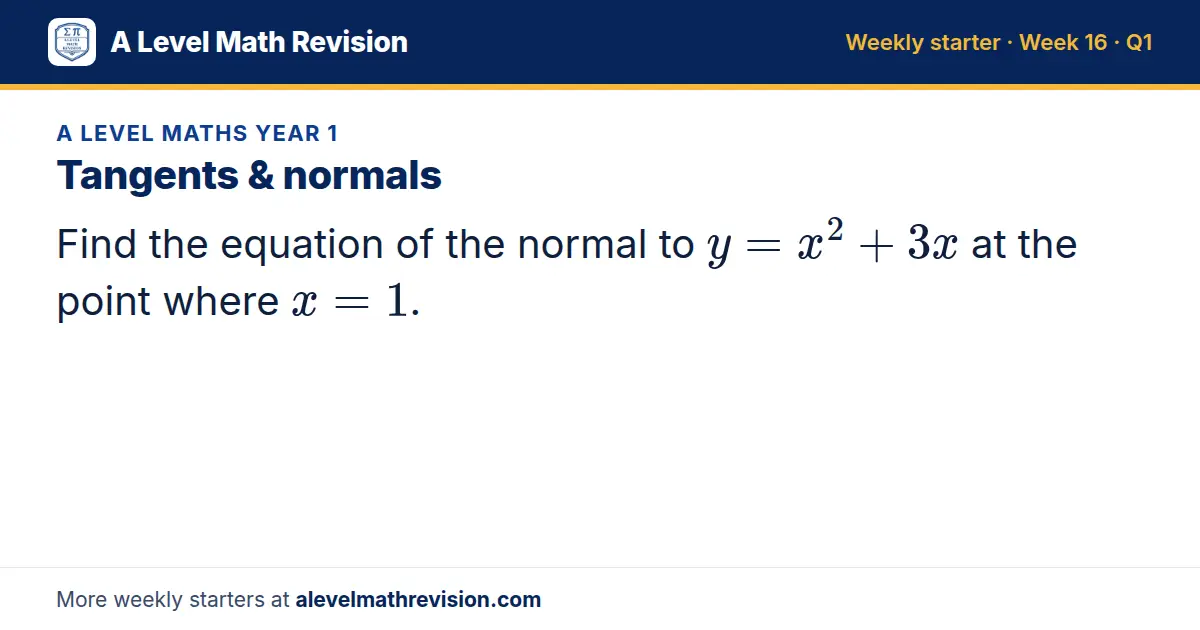
Question 1: Tangents & normals
Find the equation of the normal to y = x² + 3x at the point where x = 1.
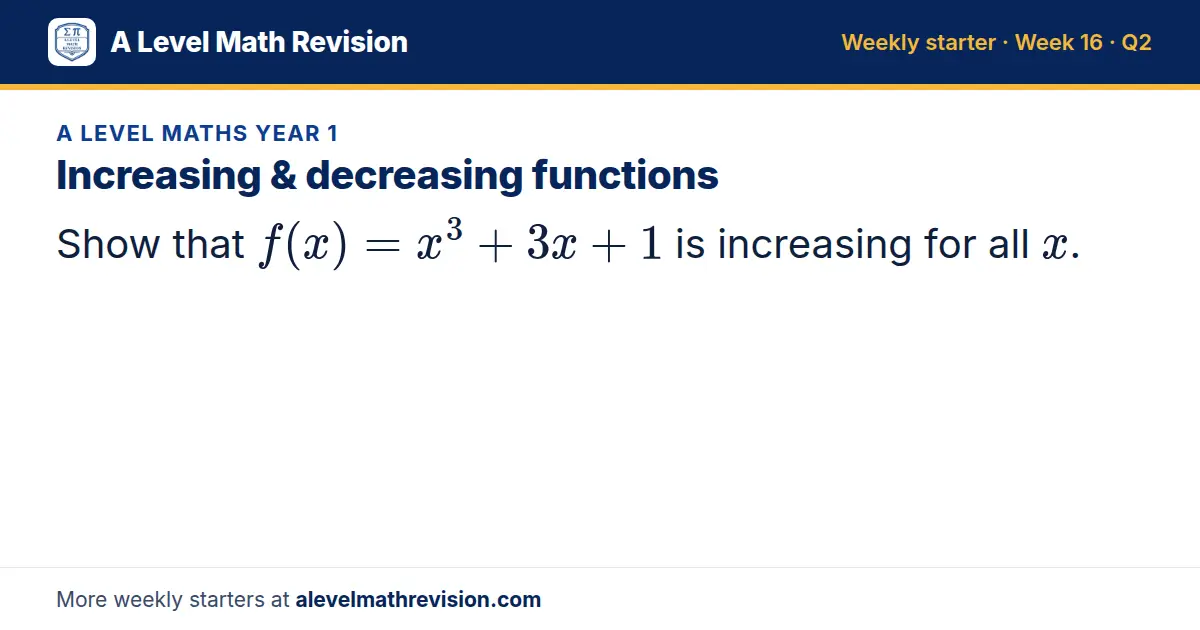
Question 2: Increasing & decreasing functions
Show that f(x) = x³ + 3x + 1 is increasing for all x.
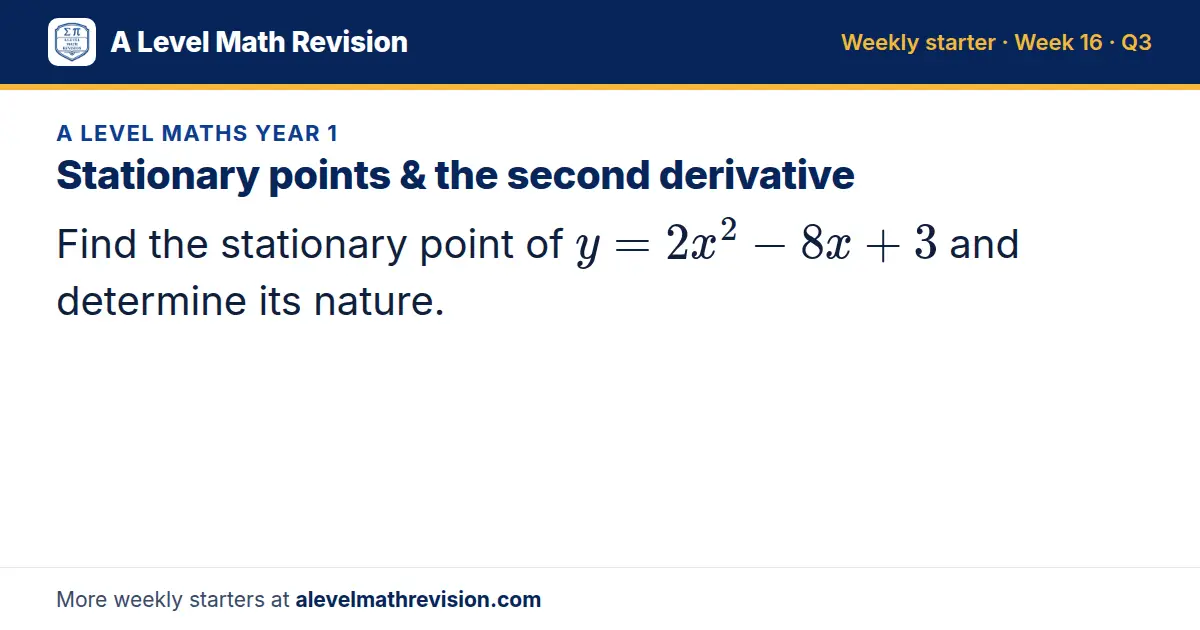
Question 3: Stationary points & the second derivative
Find the stationary point of y = 2x² - 8x + 3 and determine its nature.
Week 17
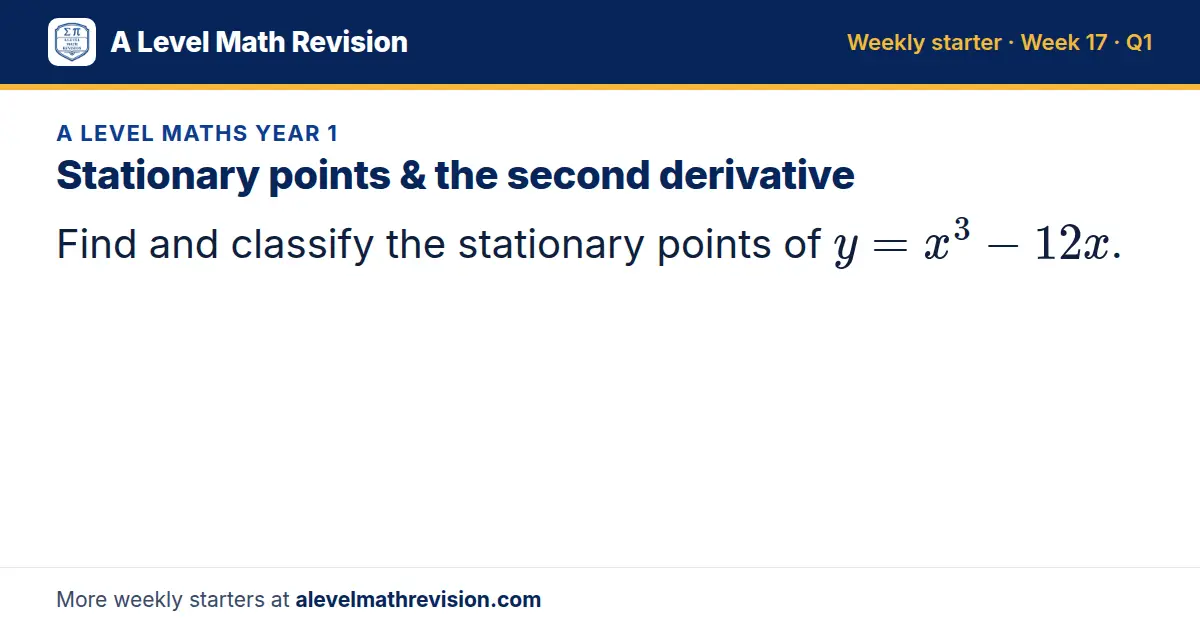
Question 1: Stationary points & the second derivative
Find and classify the stationary points of y = x³ - 12x.
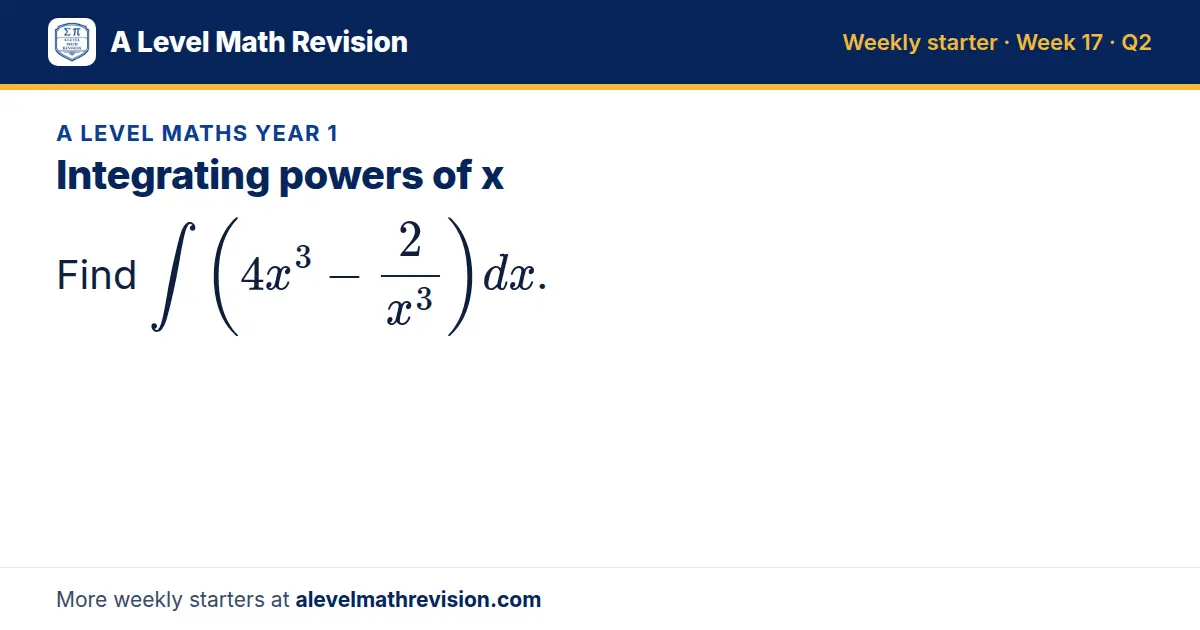
Question 2: Integrating powers of x
Find ∫ (4x³ - 2/(x³))dx.
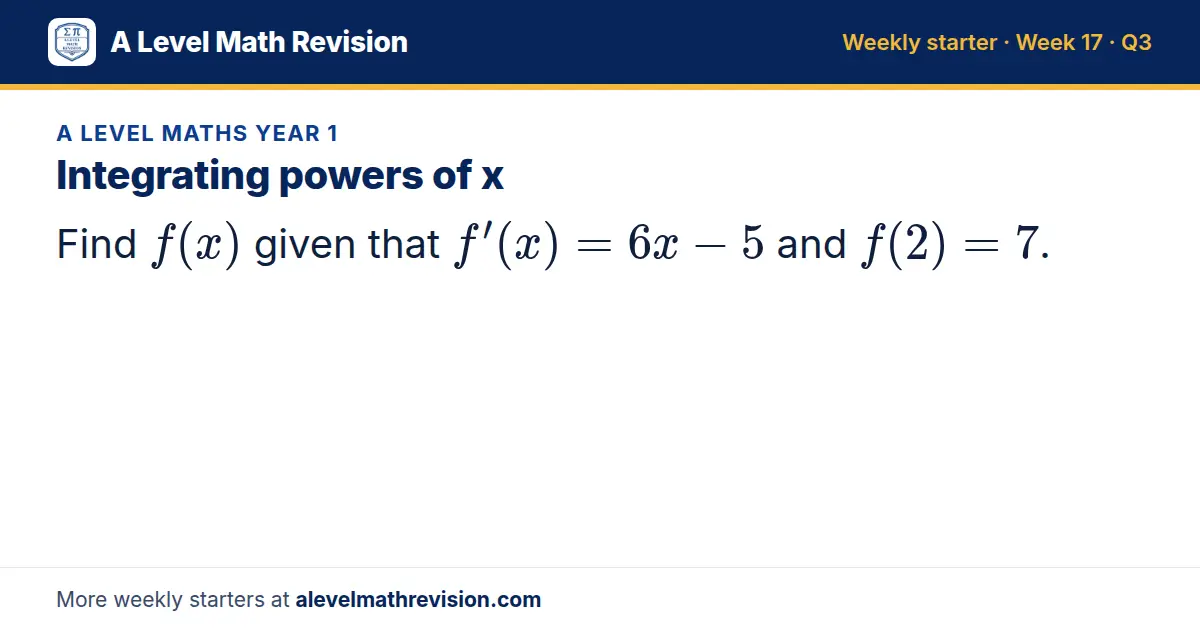
Question 3: Integrating powers of x
Find f(x) given that f'(x) = 6x - 5 and f(2) = 7.
Week 18
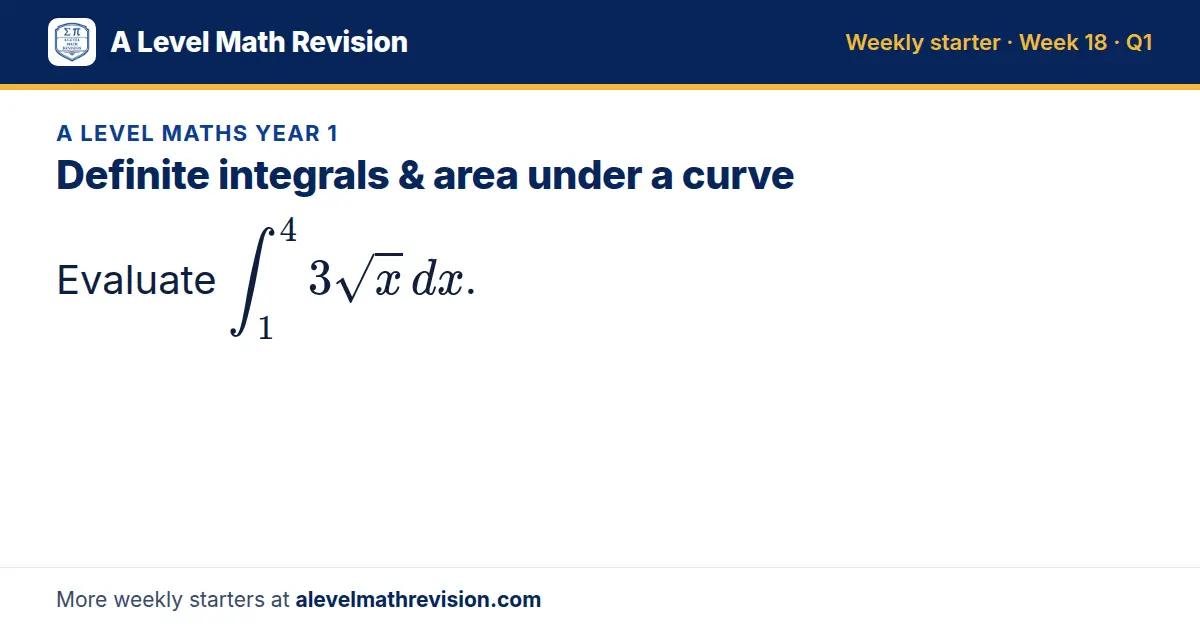
Question 1: Definite integrals & area under a curve
Evaluate ∫_1⁴ 3√x dx.
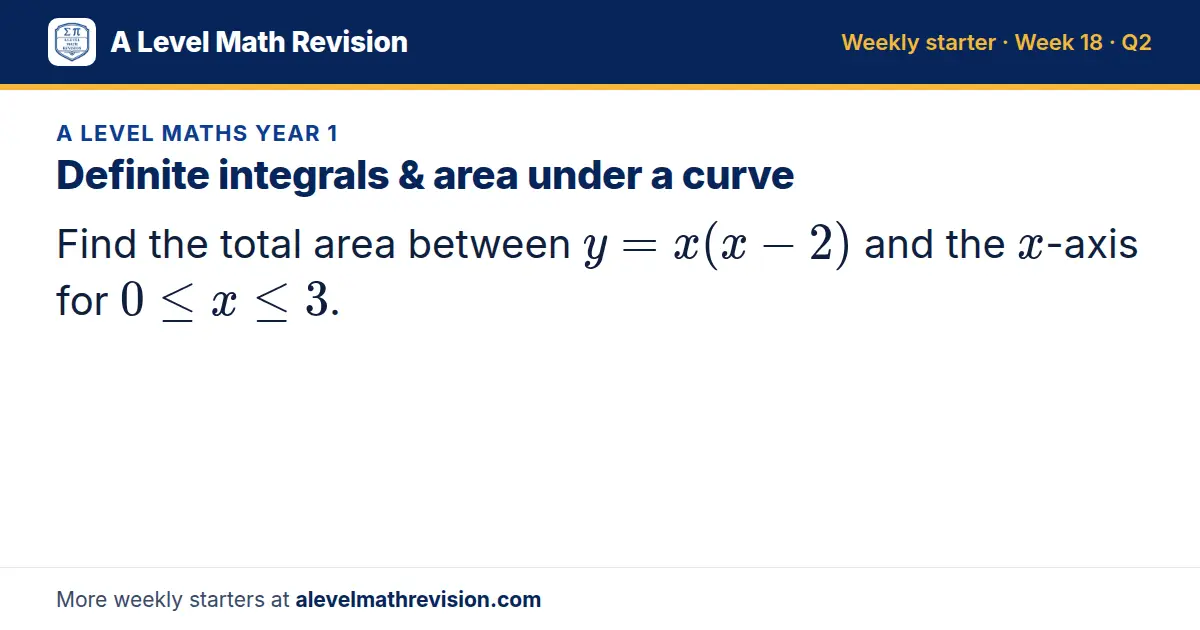
Question 2: Definite integrals & area under a curve
Find the total area between y = x(x - 2) and the x-axis for 0 ≤ x ≤ 3.
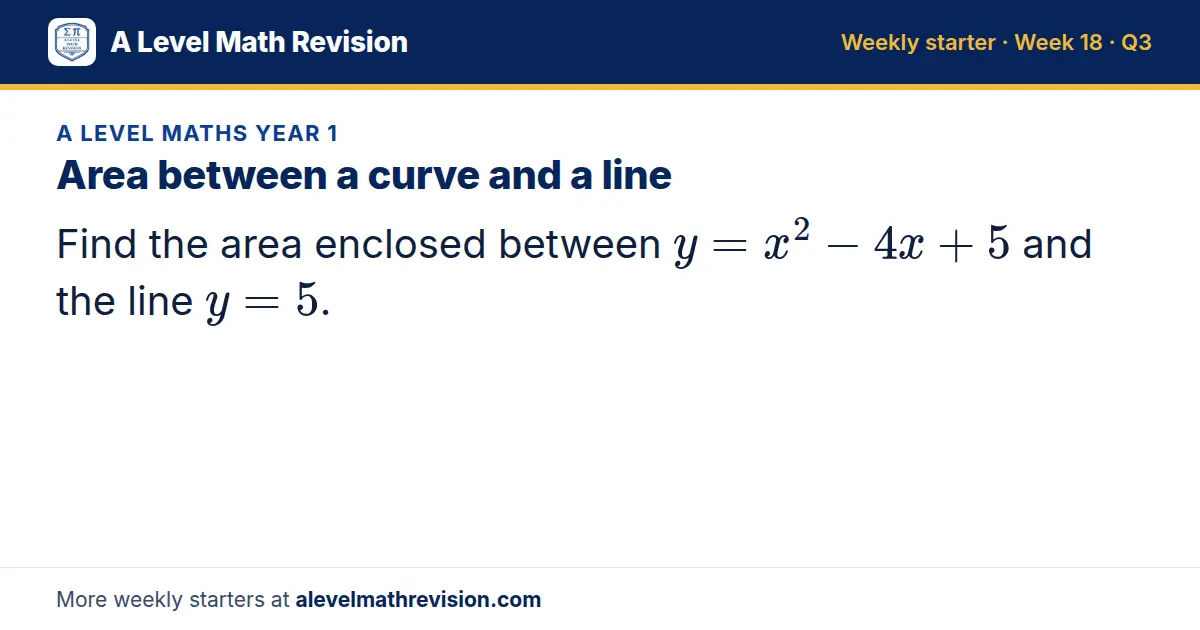
Question 3: Area between a curve and a line
Find the area enclosed between y = x² - 4x + 5 and the line y = 5.
Week 19
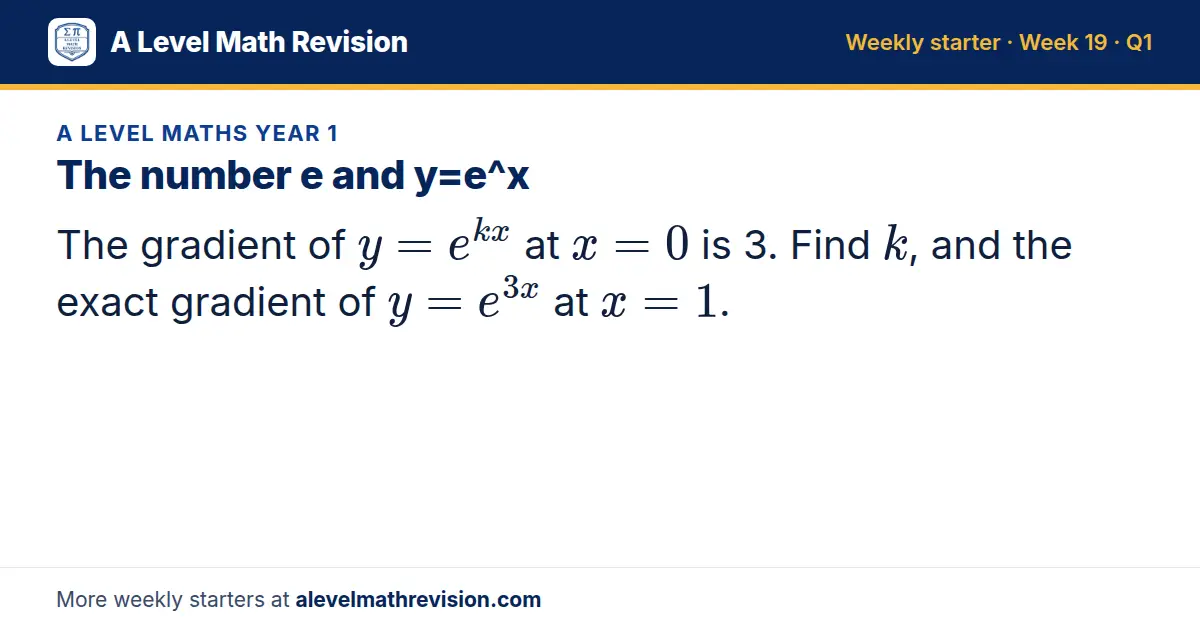
Question 1: The number e and y=e^x
The gradient of y = e^(kx) at x = 0 is 3. Find k, and the exact gradient of y = e^(3x) at x = 1.
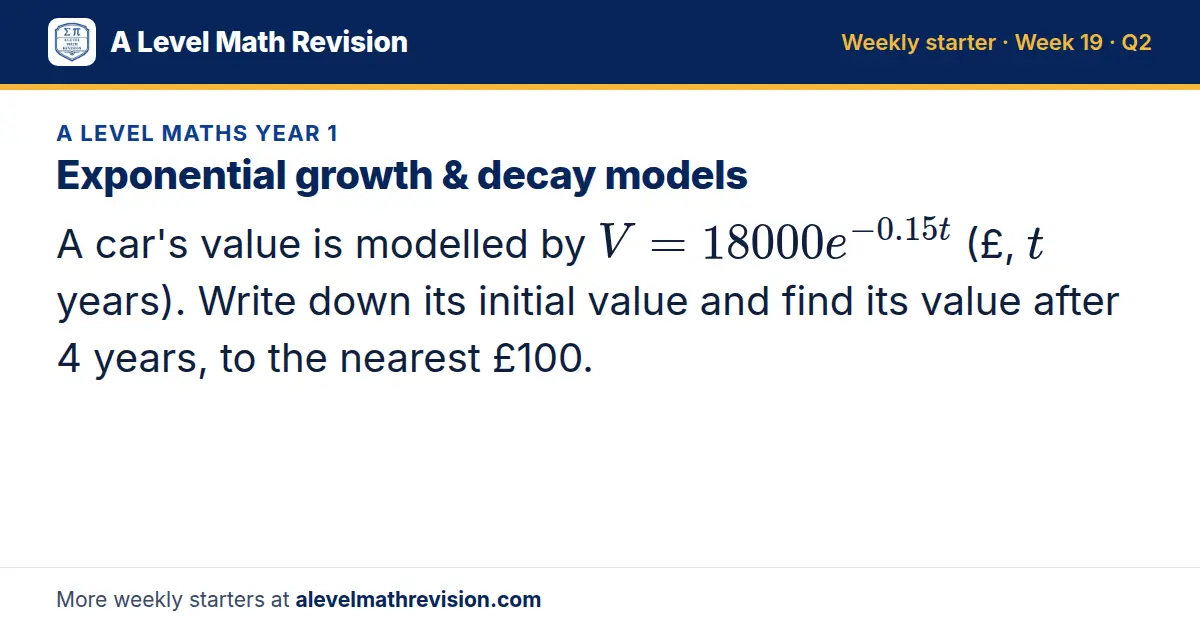
Question 2: Exponential growth & decay models
A car's value is modelled by V = 18000e^(-0.15t) (£, t years). Write down its initial value and find its value after 4 years, to the nearest £100.
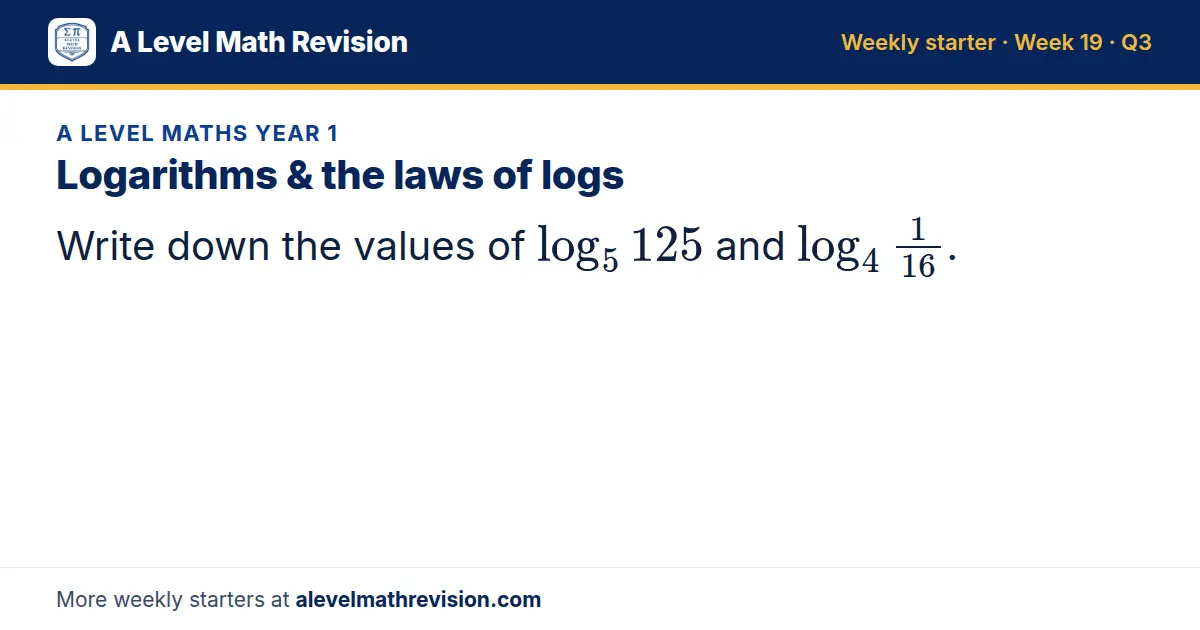
Question 3: Logarithms & the laws of logs
Write down the values of log_5 125 and log_4 1/16.
Week 20
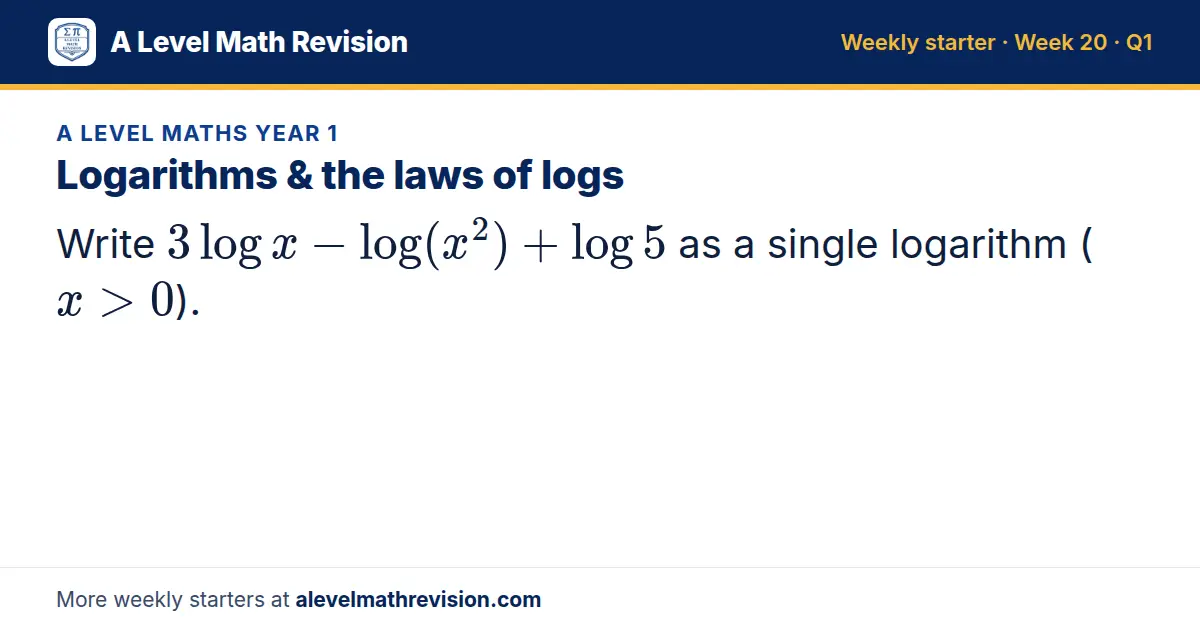
Question 1: Logarithms & the laws of logs
Write 3log x - log(x²) + log 5 as a single logarithm (x > 0).
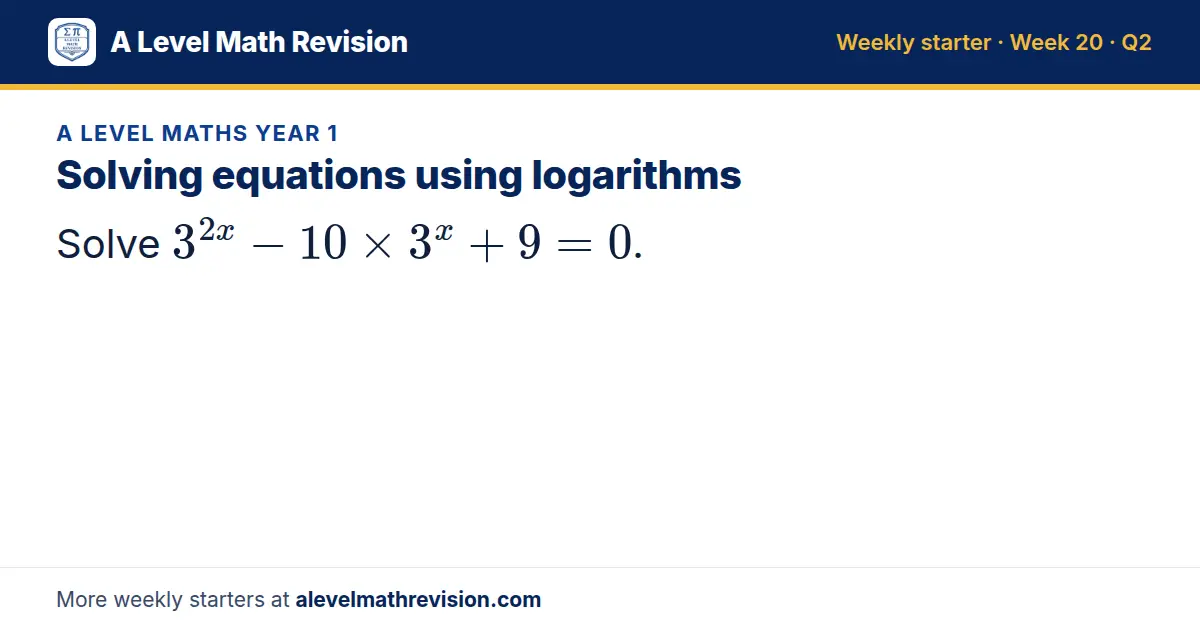
Question 2: Solving equations using logarithms
Solve 3^(2x) - 10 × 3^x + 9 = 0.
Question 3: Linearising data with logs
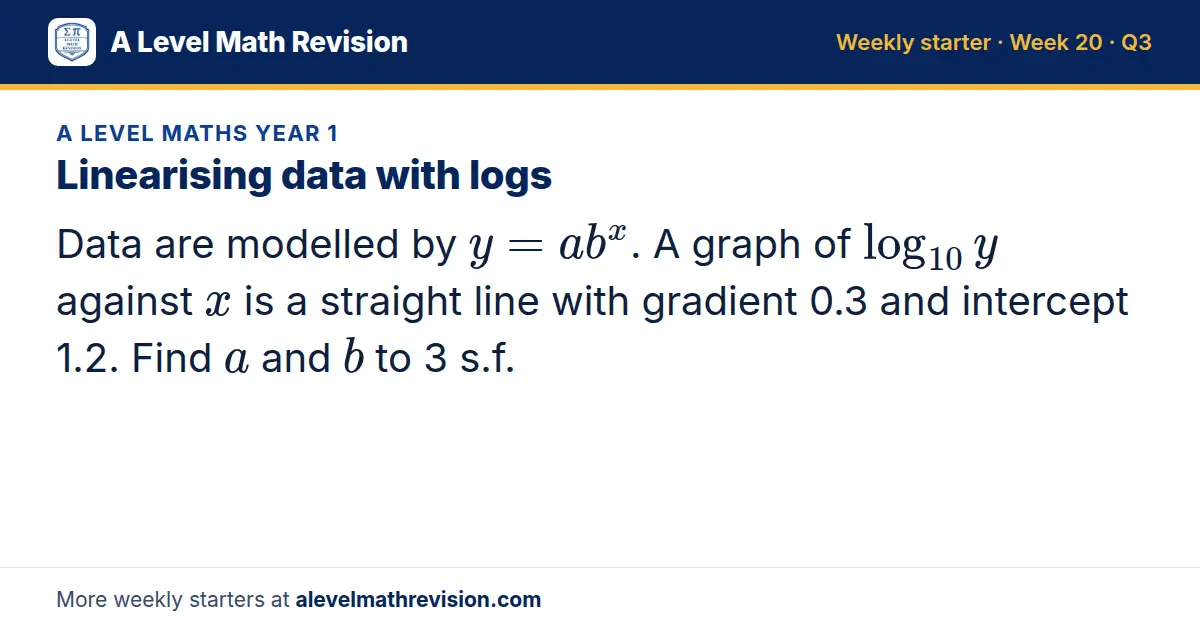
Data are modelled by y = ab^x. A graph of log_10 y against x is a straight line with gradient 0.3 and intercept 1.2. Find a and b to 3 s.f.
Week 21
Question 1: Populations, samples & census
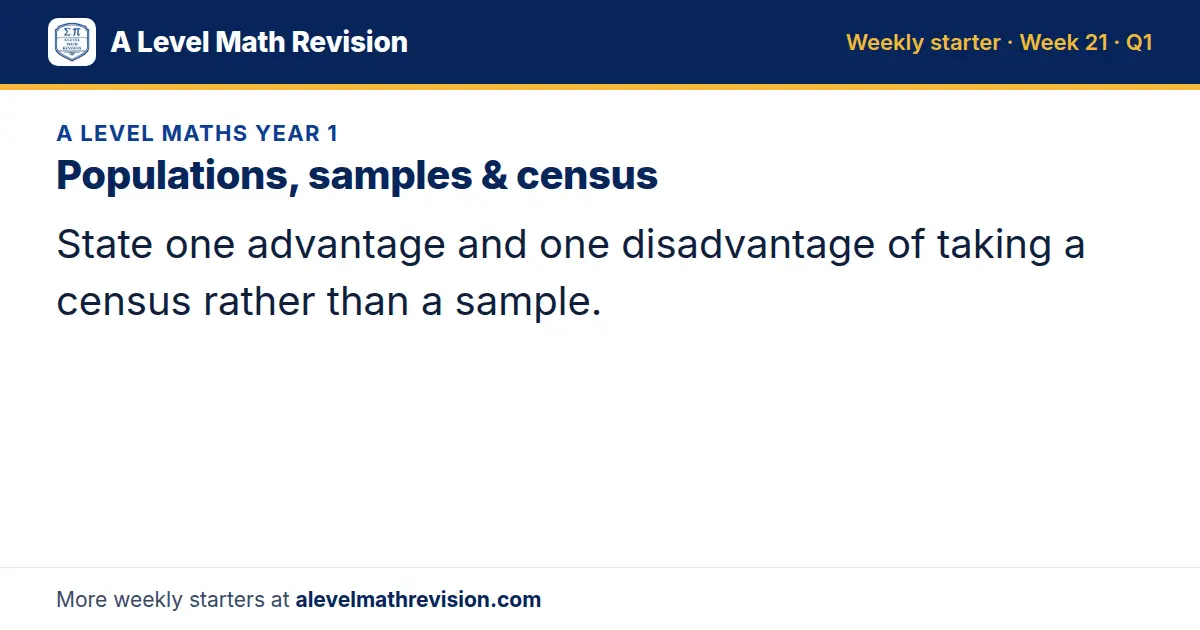
State one advantage and one disadvantage of taking a census rather than a sample.
Question 2: Simple random sampling
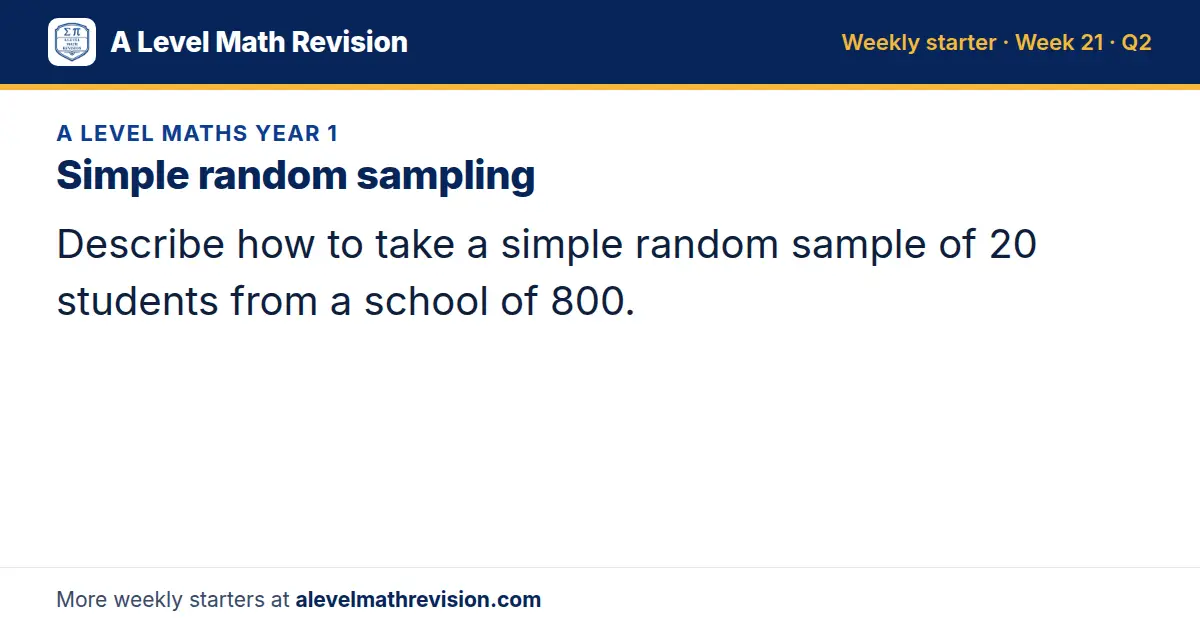
Describe how to take a simple random sample of 20 students from a school of 800.
Question 3: Systematic, stratified, quota & opportunity sampling
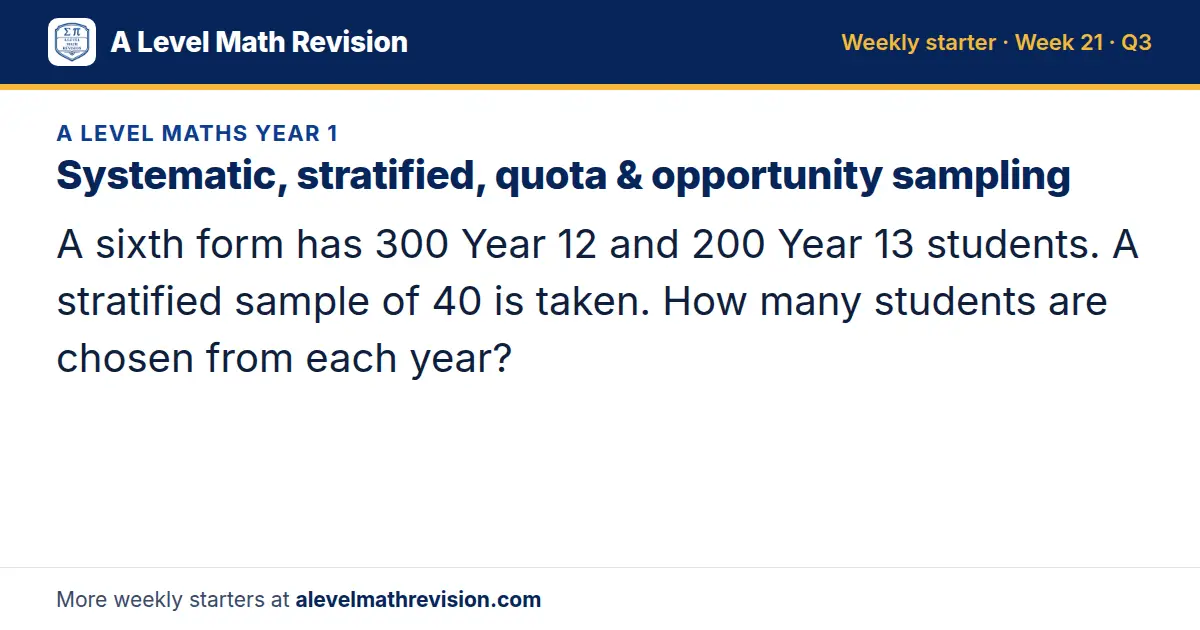
A sixth form has 300 Year 12 and 200 Year 13 students. A stratified sample of 40 is taken. How many students are chosen from each year?
Week 22
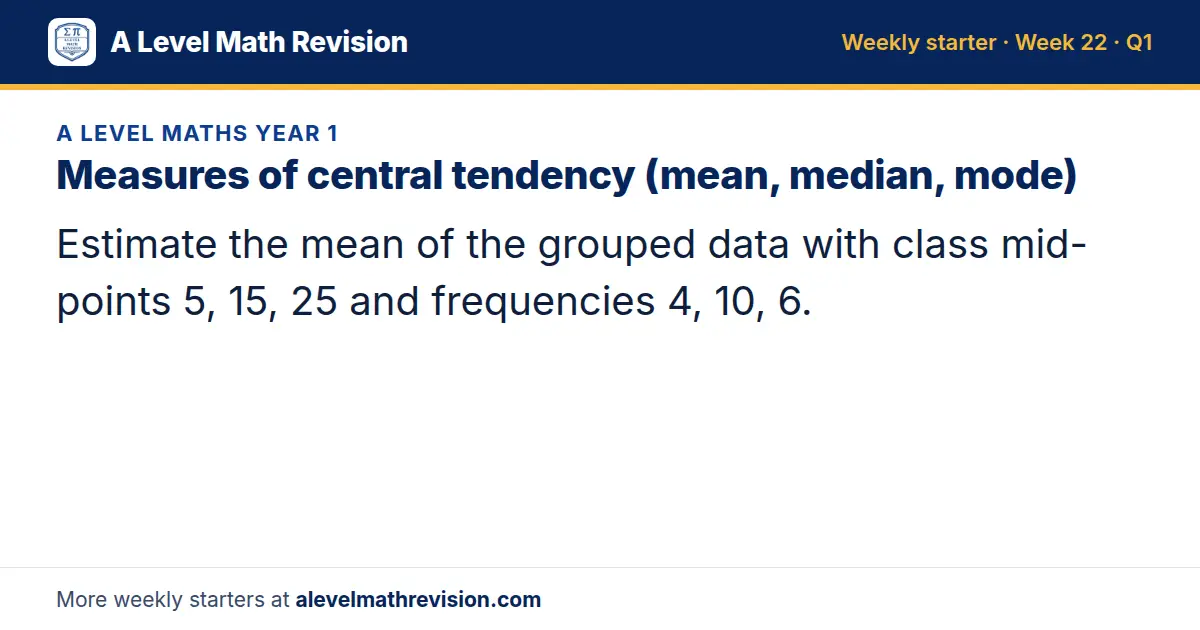
Question 1: Measures of central tendency (mean, median, mode)
Estimate the mean of the grouped data with class mid-points 5, 15, 25 and frequencies 4, 10, 6.
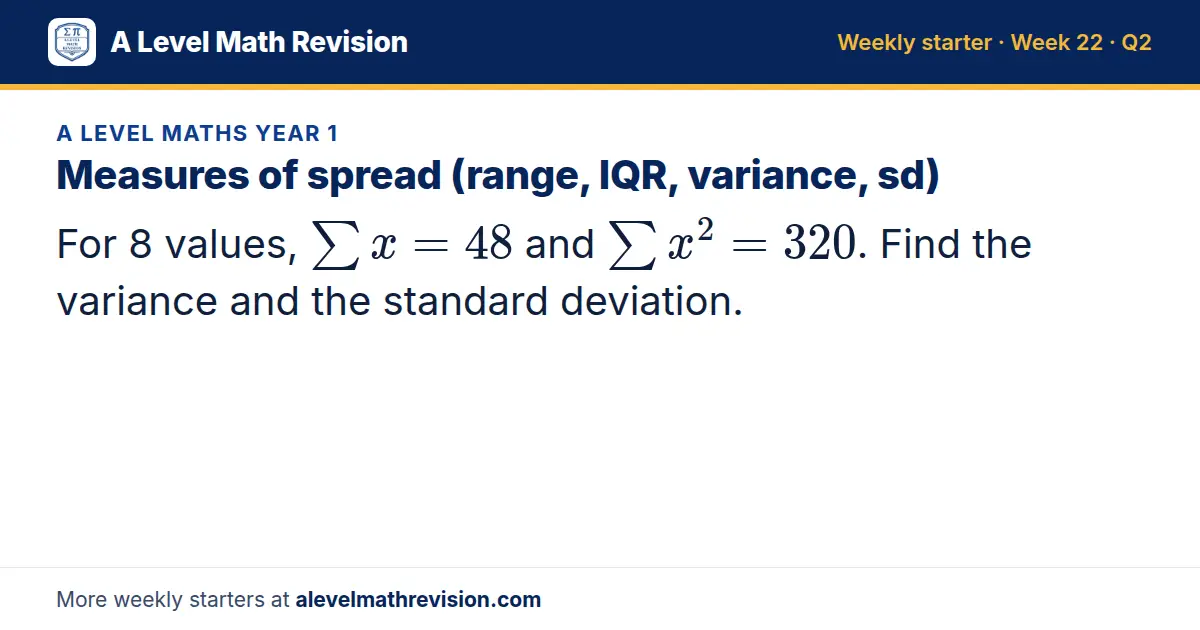
Question 2: Measures of spread (range, IQR, variance, sd)
For 8 values, Σ x = 48 and Σ x² = 320. Find the variance and the standard deviation.
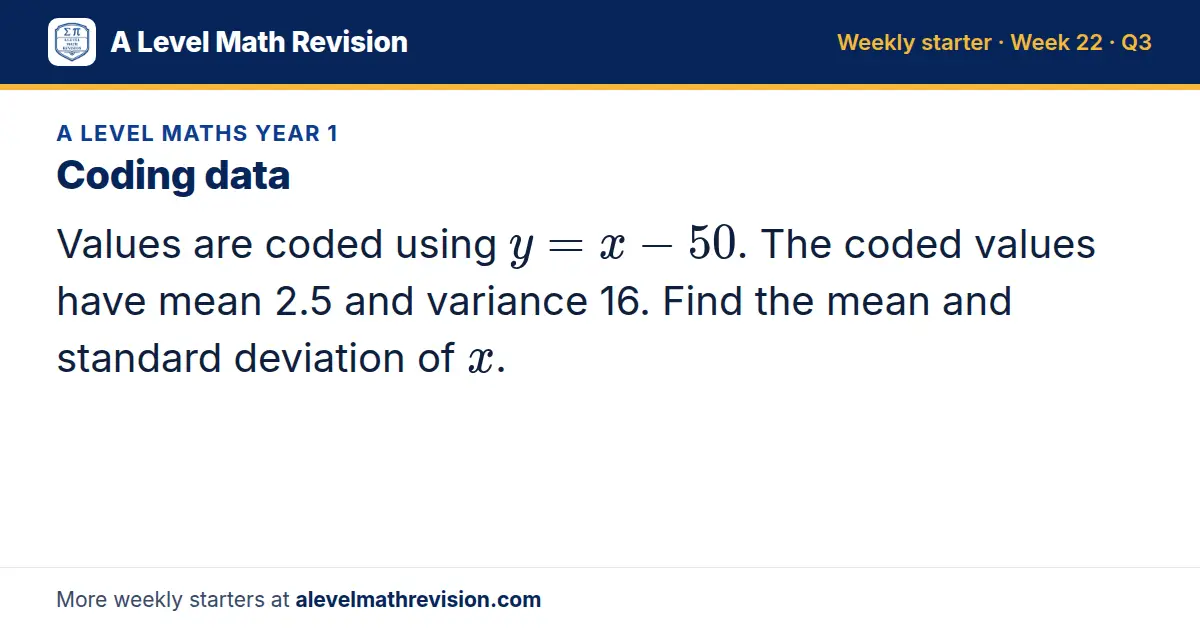
Question 3: Coding data
Values are coded using y = x - 50. The coded values have mean 2.5 and variance 16. Find the mean and standard deviation of x.
Week 23
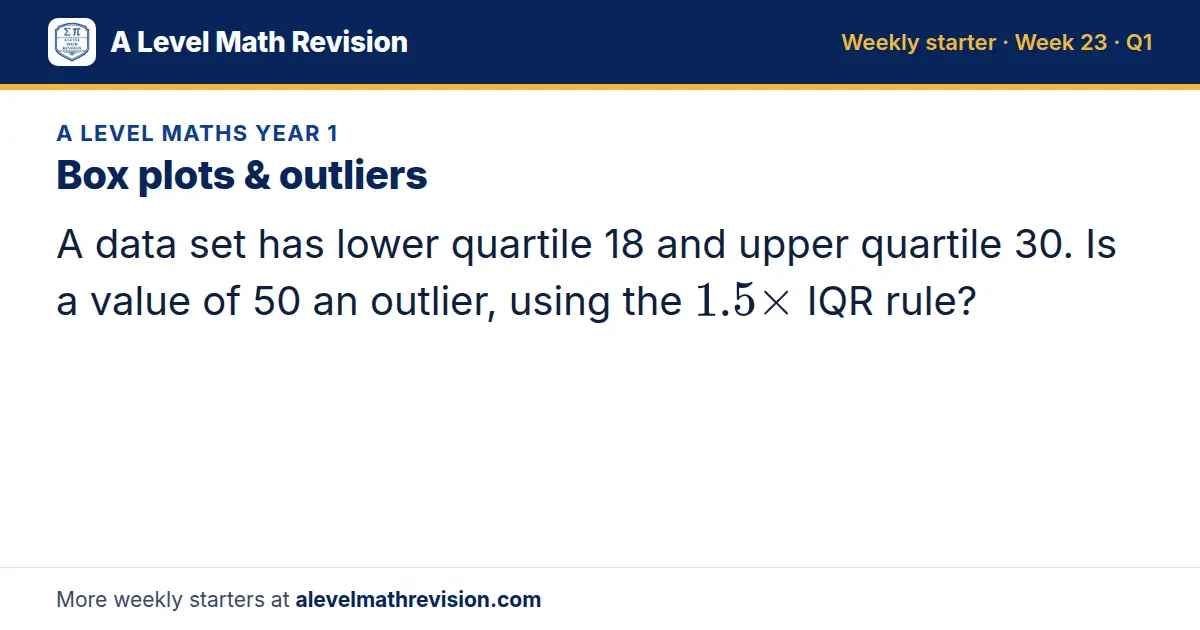
Question 1: Box plots & outliers
A data set has lower quartile 18 and upper quartile 30. Is a value of 50 an outlier, using the 1.5 × IQR rule?
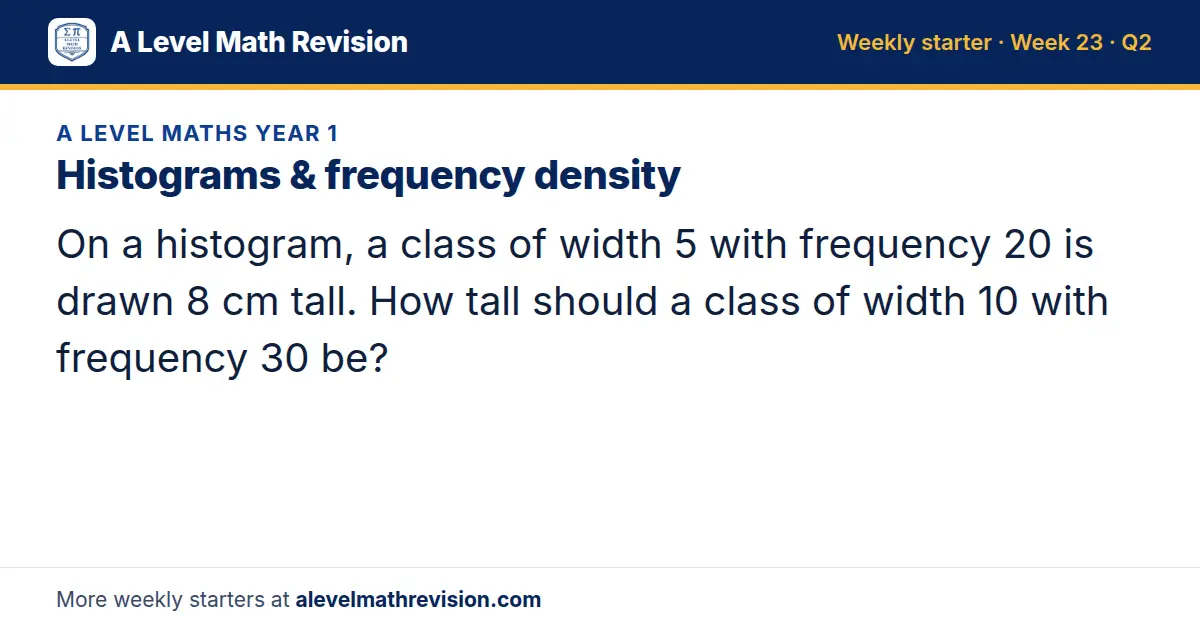
Question 2: Histograms & frequency density
On a histogram, a class of width 5 with frequency 20 is drawn 8 cm tall. How tall should a class of width 10 with frequency 30 be?
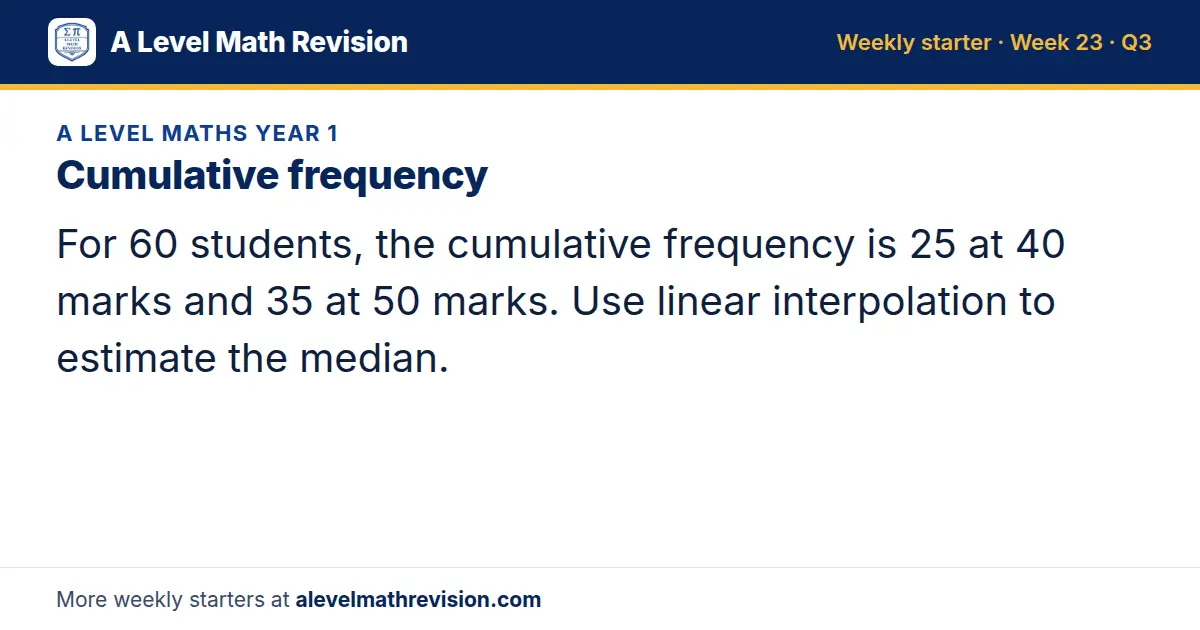
Question 3: Cumulative frequency
For 60 students, the cumulative frequency is 25 at 40 marks and 35 at 50 marks. Use linear interpolation to estimate the median.
Week 24
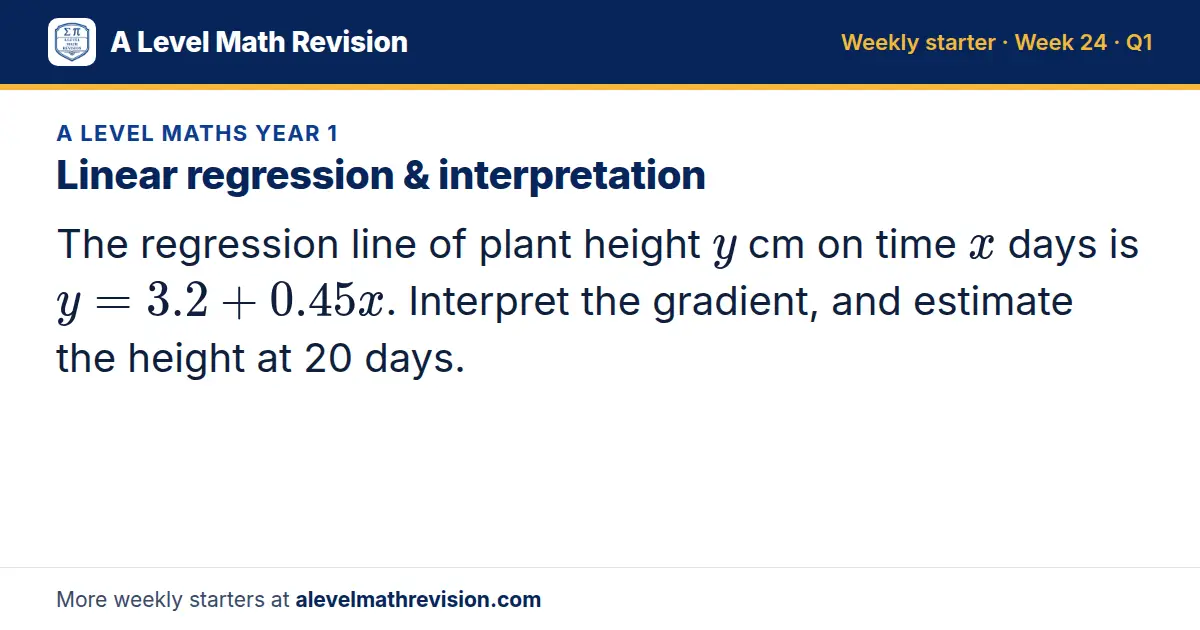
Question 1: Linear regression & interpretation
The regression line of plant height y cm on time x days is y = 3.2 + 0.45x. Interpret the gradient, and estimate the height at 20 days.

Question 2: Venn diagrams
In a class of 30, 18 play football, 12 play tennis and 5 play both. Find the probability that a student chosen at random plays neither.
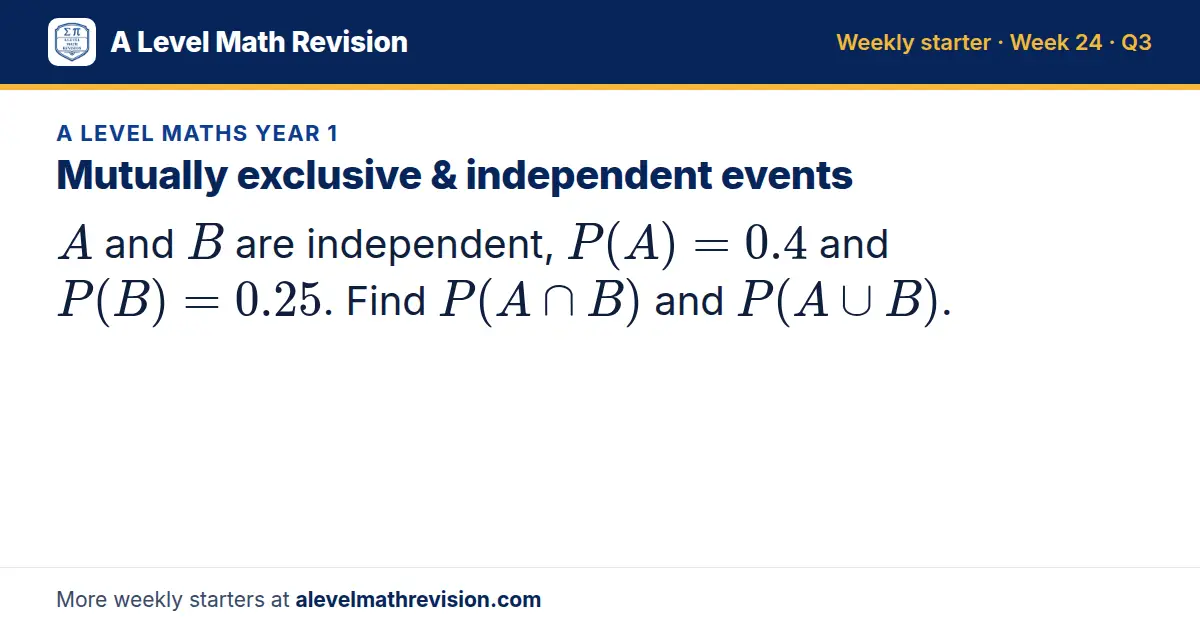
Question 3: Mutually exclusive & independent events
A and B are independent, P(A) = 0.4 and P(B) = 0.25. Find P(A ∩ B) and P(A ∪ B).
Week 25
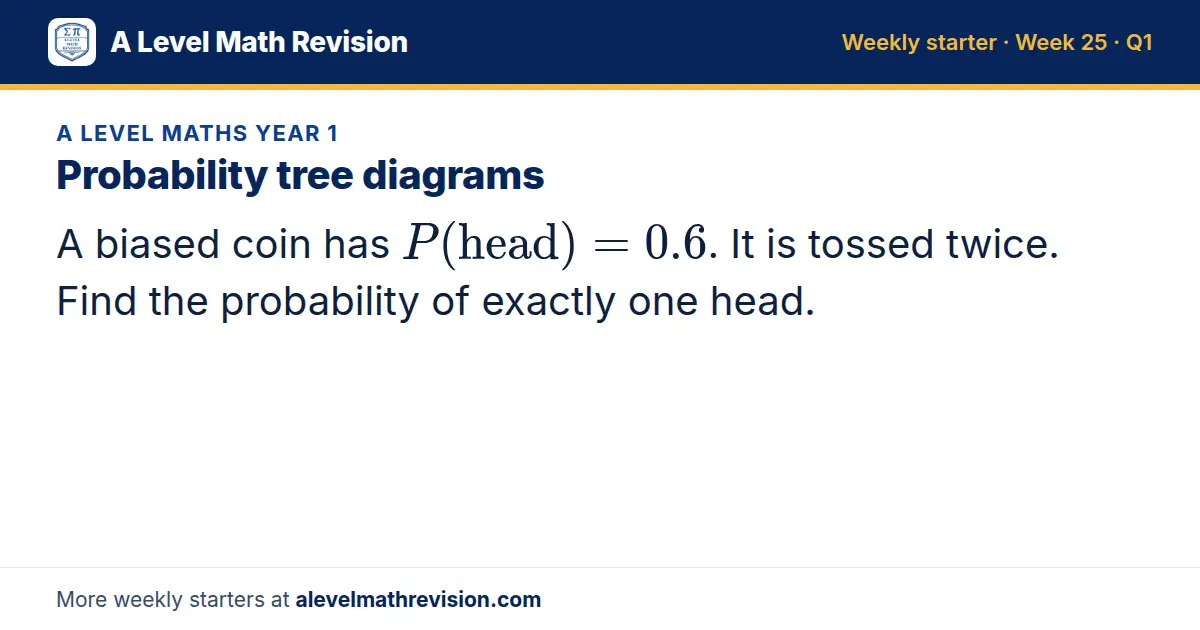
Question 1: Probability tree diagrams
A biased coin has P(head) = 0.6. It is tossed twice. Find the probability of exactly one head.
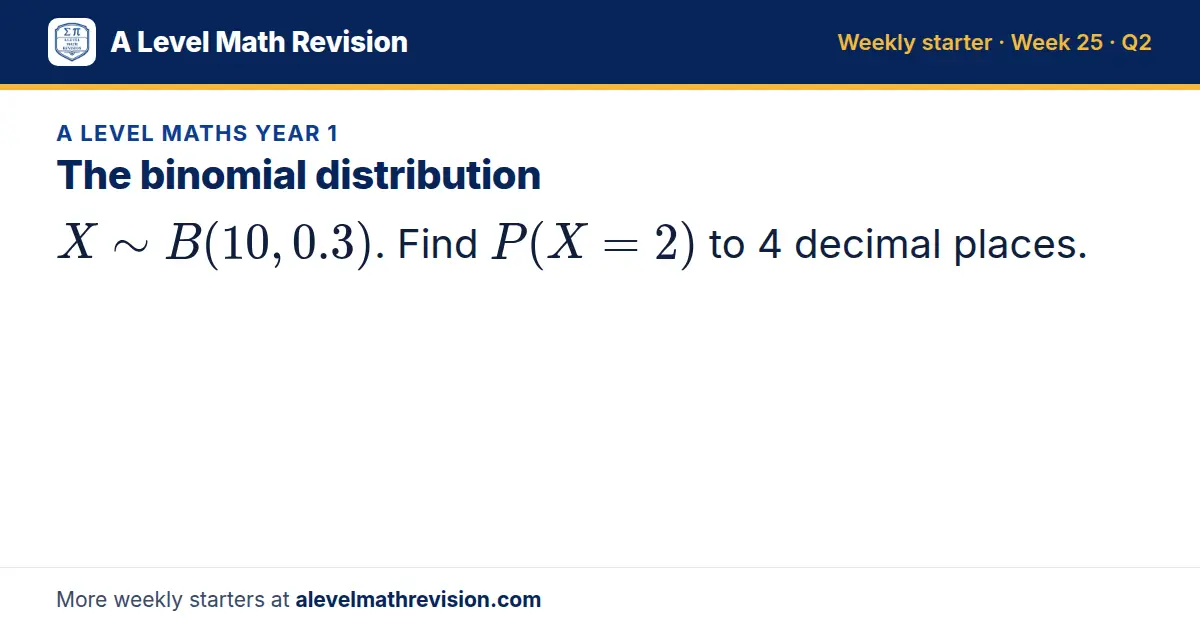
Question 2: The binomial distribution
X B(10, 0.3). Find P(X = 2) to 4 decimal places.
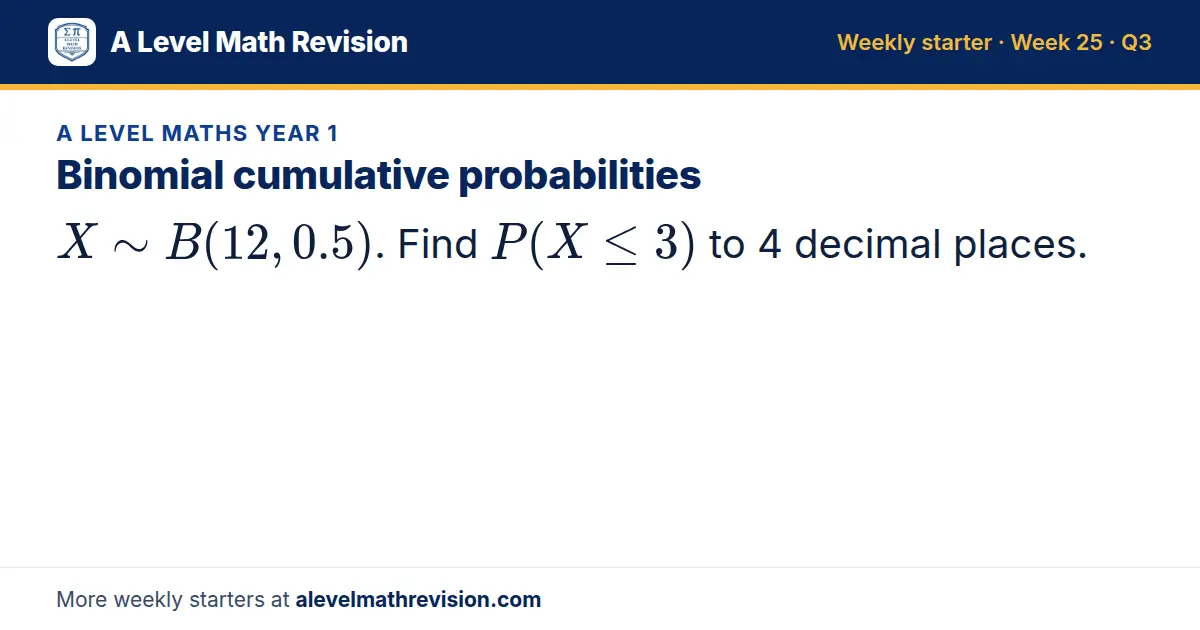
Question 3: Binomial cumulative probabilities
X B(12, 0.5). Find P(X ≤ 3) to 4 decimal places.
Week 26
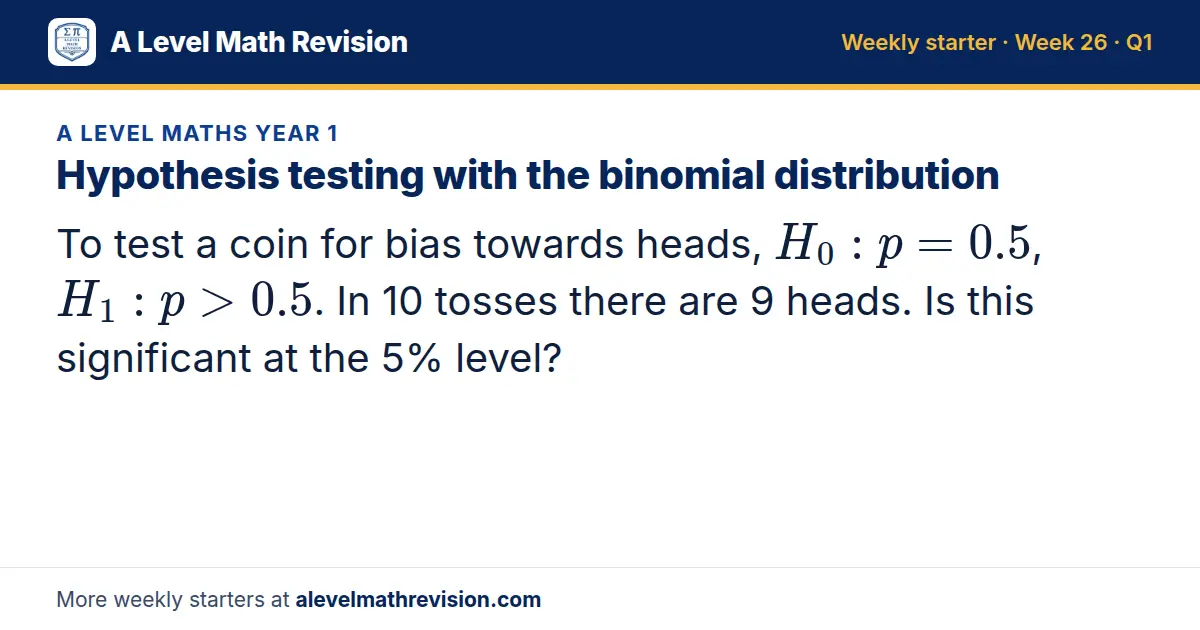
Question 1: Hypothesis testing with the binomial distribution
To test a coin for bias towards heads, H_0: p = 0.5, H_1: p > 0.5. In 10 tosses there are 9 heads. Is this significant at the 5% level?
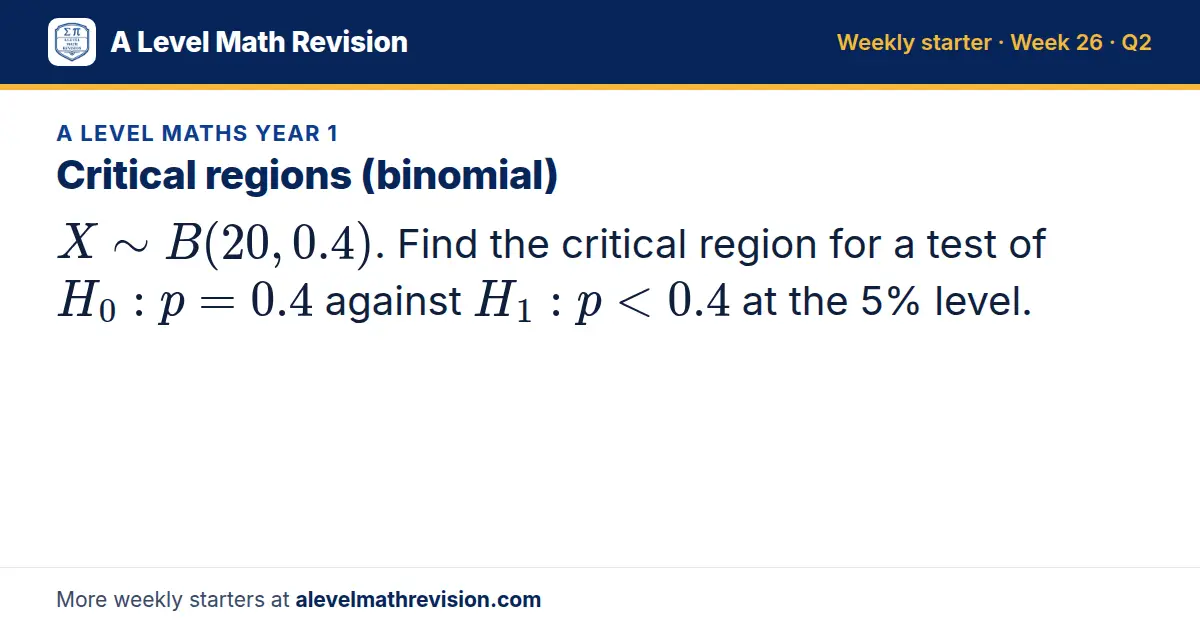
Question 2: Critical regions (binomial)
X B(20, 0.4). Find the critical region for a test of H_0: p = 0.4 against H_1: p < 0.4 at the 5% level.
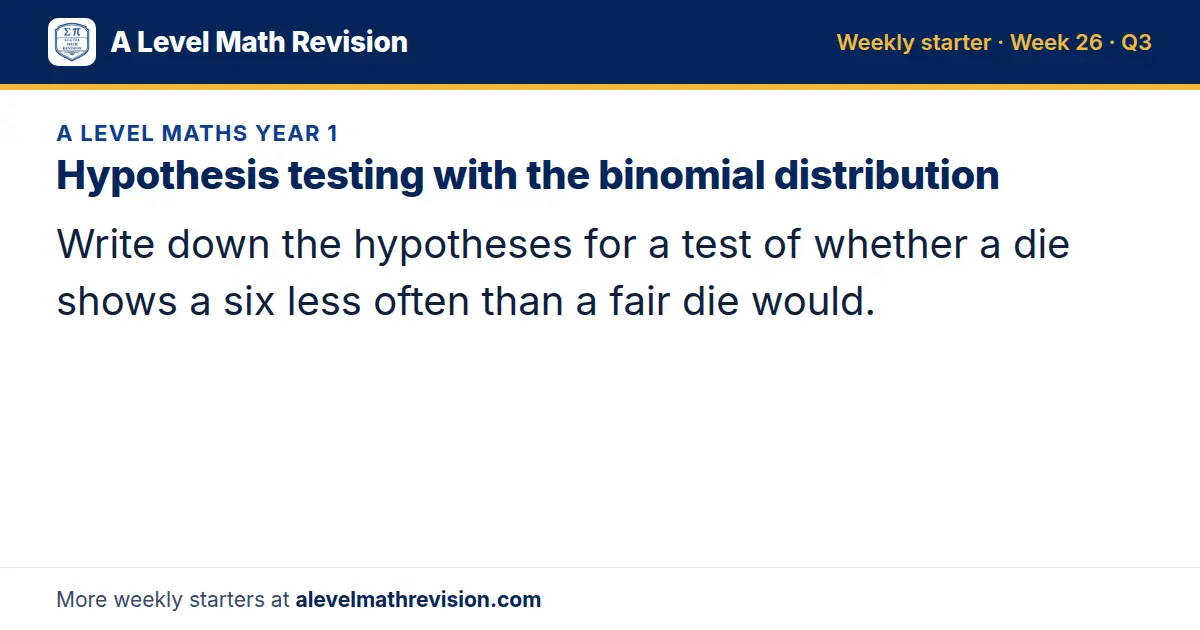
Question 3: Hypothesis testing with the binomial distribution
Write down the hypotheses for a test of whether a die shows a six less often than a fair die would.
More starter questions
Other weeks: Weeks 1–13 · Weeks 14–26 · Weeks 27–40. Answers and mark schemes are in the starter tasks for teachers.